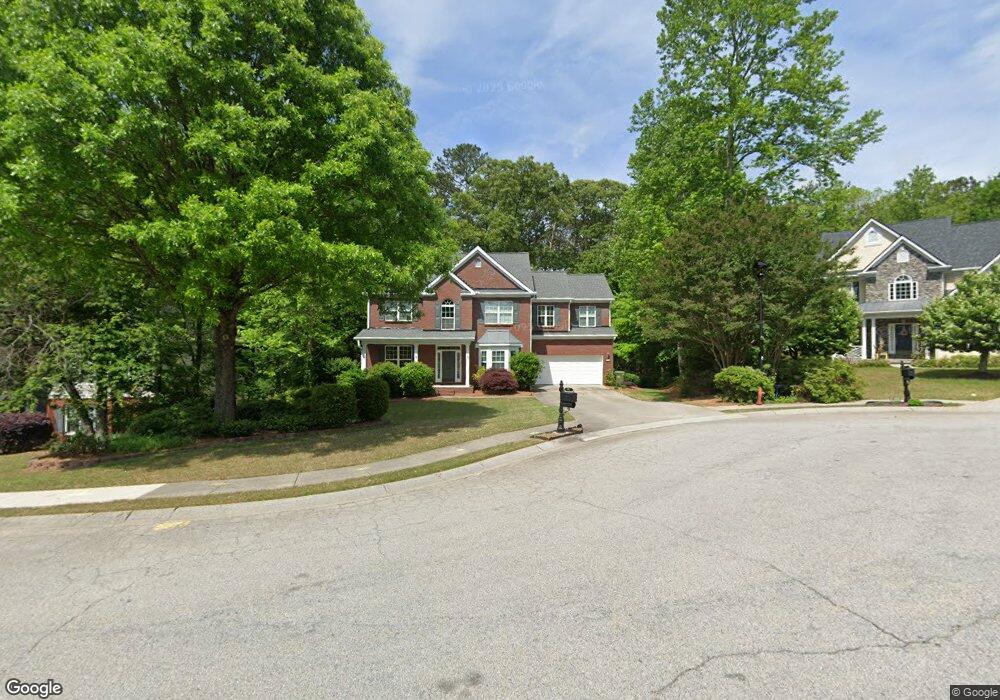
305 Tanglewood Trail Carrollton, GA 30116
Estimated Value: $397,000 - $492,000
4
Beds
4
Baths
2,442
Sq Ft
$179/Sq Ft
Est. Value
About This Home
This home is located at 305 Tanglewood Trail, Carrollton, GA 30116 and is currently estimated at $436,581, approximately $178 per square foot. 305 Tanglewood Trail is a home located in Carroll County with nearby schools including Carrollton Elementary School, Carrollton Upper Elementary School, and Carrollton Middle School.
Ownership History
Date
Name
Owned For
Owner Type
Purchase Details
Closed on
Aug 17, 2011
Sold by
Bowen Brendan
Bought by
Bowen Brendan
Current Estimated Value
Home Financials for this Owner
Home Financials are based on the most recent Mortgage that was taken out on this home.
Original Mortgage
$175,000
Outstanding Balance
$120,074
Interest Rate
4.53%
Mortgage Type
New Conventional
Estimated Equity
$316,508
Purchase Details
Closed on
Oct 11, 2006
Sold by
Patrick Malloy Communities
Bought by
Thompson Charles K
Home Financials for this Owner
Home Financials are based on the most recent Mortgage that was taken out on this home.
Original Mortgage
$214,696
Interest Rate
6.39%
Mortgage Type
New Conventional
Purchase Details
Closed on
May 3, 2006
Sold by
Mill Pond Llc
Bought by
Patrick Malloy Communities Llc
Purchase Details
Closed on
Oct 22, 1999
Bought by
Mill Pond Llc
Create a Home Valuation Report for This Property
The Home Valuation Report is an in-depth analysis detailing your home's value as well as a comparison with similar homes in the area
Home Values in the Area
Average Home Value in this Area
Purchase History
| Date | Buyer | Sale Price | Title Company |
|---|---|---|---|
| Bowen Brendan | -- | -- | |
| Bowen Brendan | $260,000 | -- | |
| Thompson Charles K | $268,370 | -- | |
| Patrick Malloy Communities Llc | $217,540 | -- | |
| Patrick Malloy Communities Llc | $217,540 | -- | |
| Mill Pond Llc | -- | -- |
Source: Public Records
Mortgage History
| Date | Status | Borrower | Loan Amount |
|---|---|---|---|
| Open | Patrick Malloy Communities Llc | $175,000 | |
| Previous Owner | Thompson Charles K | $214,696 |
Source: Public Records
Tax History Compared to Growth
Tax History
| Year | Tax Paid | Tax Assessment Tax Assessment Total Assessment is a certain percentage of the fair market value that is determined by local assessors to be the total taxable value of land and additions on the property. | Land | Improvement |
|---|---|---|---|---|
| 2025 | $4,326 | $184,568 | $20,000 | $164,568 |
| 2024 | $4,462 | $184,568 | $20,000 | $164,568 |
| 2023 | $4,462 | $170,118 | $20,000 | $150,118 |
| 2022 | $3,713 | $140,486 | $20,000 | $120,486 |
| 2021 | $3,310 | $122,942 | $20,000 | $102,942 |
| 2020 | $3,095 | $113,464 | $20,000 | $93,464 |
| 2019 | $2,941 | $105,656 | $20,000 | $85,656 |
| 2018 | $2,716 | $94,783 | $20,000 | $74,783 |
| 2017 | $2,731 | $94,783 | $20,000 | $74,783 |
| 2016 | $2,746 | $94,783 | $20,000 | $74,783 |
| 2015 | $2,866 | $96,775 | $14,400 | $82,376 |
| 2014 | $2,685 | $90,548 | $14,400 | $76,148 |
Source: Public Records
Map
Nearby Homes
- 103 Thornbrook Ct
- 301 Retreat Way
- 207 Retreat Way
- 1209 Old Newnan Rd
- 1201 Old Newnan Rd
- 129 Deer Park Dr
- 217 Summer Chase
- 141 Mill Pond Crossing
- 39 Hampton Way
- 207 Meadow Lake Dr
- 1745 Stripling Chapel Rd
- 103 Champion Dr
- 143 Brookstone Dr
- 204 Pinehurst Way
- 106 Victoria Vining
- 213 Shady Valley Dr
- 158 Foggy Bottom Dr
- 106 Victoria Way
- 333 Brookstone Dr
- 109 National Way
- 305 Tanglewood Trail
- 303 Tanglewood Trail
- 307 Tanglewood Trail
- 301 Tanglewood Trail
- 213 Tanglewood Trail
- 306 Tanglewood Trail
- 85 Oak Mountain Trail
- 211 Tanglewood Trail
- 308 Tanglewood Trail Unit 25
- 308 Tanglewood Trail
- 302 Tanglewood Trail
- 101 Turning Leaf Ct
- 209 Tanglewood Trail
- 0 Turning Leaf Unit 3143274
- 100 Turning Leaf Ct
- 207 Tanglewood Trail
- 212 Tanglewood Trail
- 208 Tanglewood Trail
- 105 Turning Leaf Ct Unit 19,20A
- 105 Turning Leaf Ct Unit 20