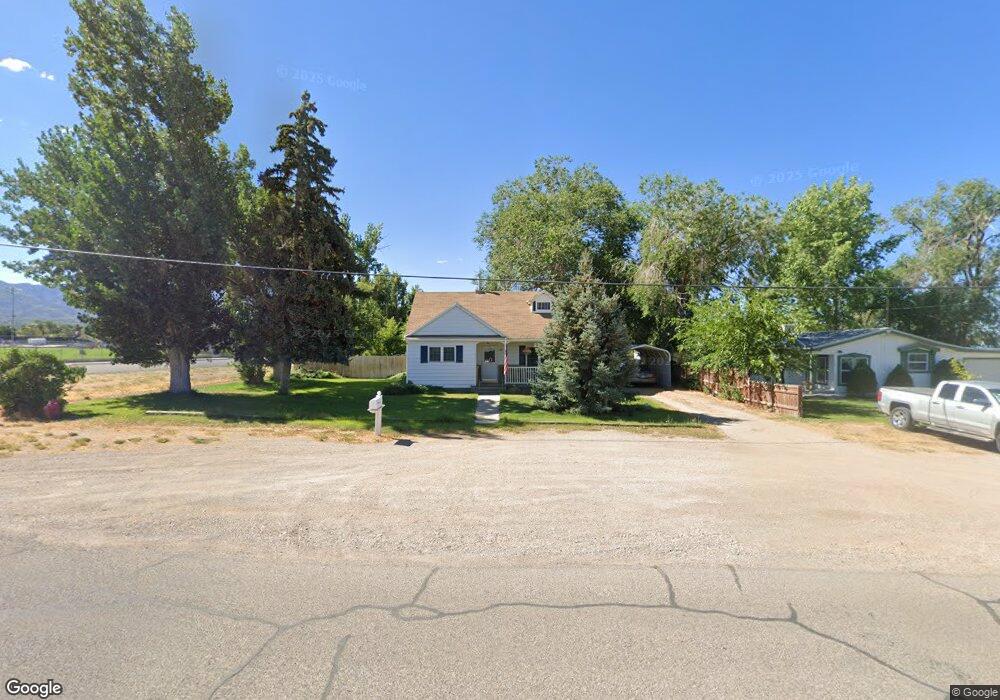
305 W 100 N Fillmore, UT 84631
Estimated Value: $260,059 - $406,000
3
Beds
2
Baths
1,895
Sq Ft
$171/Sq Ft
Est. Value
About This Home
This home is located at 305 W 100 N, Fillmore, UT 84631 and is currently estimated at $324,015, approximately $170 per square foot. 305 W 100 N is a home located in Millard County.
Ownership History
Date
Name
Owned For
Owner Type
Purchase Details
Closed on
May 8, 2006
Sold by
Thompson Sally I
Bought by
Alfieri Louis D and Alfieri Maragaret A
Current Estimated Value
Purchase Details
Closed on
Aug 1, 2005
Sold by
Carlisle Ken and Plocker John
Bought by
Thompson Sally I
Home Financials for this Owner
Home Financials are based on the most recent Mortgage that was taken out on this home.
Original Mortgage
$90,250
Interest Rate
5.56%
Mortgage Type
New Conventional
Purchase Details
Closed on
Feb 28, 2005
Sold by
Davies Daniel D and Davies Kellee C
Bought by
Carlisle Ken and Plocker John
Create a Home Valuation Report for This Property
The Home Valuation Report is an in-depth analysis detailing your home's value as well as a comparison with similar homes in the area
Home Values in the Area
Average Home Value in this Area
Purchase History
| Date | Buyer | Sale Price | Title Company |
|---|---|---|---|
| Alfieri Louis D | -- | -- | |
| Thompson Sally I | -- | -- | |
| Carlisle Ken | -- | First American Title Insuran |
Source: Public Records
Mortgage History
| Date | Status | Borrower | Loan Amount |
|---|---|---|---|
| Previous Owner | Thompson Sally I | $90,250 |
Source: Public Records
Tax History Compared to Growth
Tax History
| Year | Tax Paid | Tax Assessment Tax Assessment Total Assessment is a certain percentage of the fair market value that is determined by local assessors to be the total taxable value of land and additions on the property. | Land | Improvement |
|---|---|---|---|---|
| 2025 | $80 | $166,075 | $22,696 | $143,379 |
| 2024 | $80 | $126,374 | $20,292 | $106,082 |
| 2023 | $221 | $126,374 | $20,292 | $106,082 |
| 2022 | $1,147 | $102,974 | $18,448 | $84,526 |
| 2021 | $1,003 | $86,442 | $11,979 | $74,463 |
| 2020 | $929 | $80,523 | $10,890 | $69,633 |
| 2019 | $792 | $68,875 | $10,890 | $57,985 |
| 2018 | $755 | $67,240 | $10,890 | $56,350 |
| 2017 | $701 | $59,293 | $10,890 | $48,403 |
| 2016 | $670 | $59,293 | $10,890 | $48,403 |
| 2015 | $670 | $59,293 | $10,890 | $48,403 |
| 2014 | -- | $59,293 | $10,890 | $48,403 |
| 2013 | -- | $59,293 | $10,890 | $48,403 |
Source: Public Records
Map
Nearby Homes
- 225 W 200 St N
- 75 N 100 West St
- 165 N 100 W
- 295 N 100 West St
- 335 W 400 North St
- 380 N 200 St W
- 390 N 100 W
- 40 S 100 Rd E
- 310 S 500 West Rd
- 120 S 100 East Rd
- 190 W 400 St S
- 410 W 400 N
- 220 S 200 E
- 155 E 500 St S
- 157 E 500 South St
- 430 E Canyon Rd
- 405 E 500 St S
- 310 S 600 E
- 760 E 700 St S
- 690 E 500 S