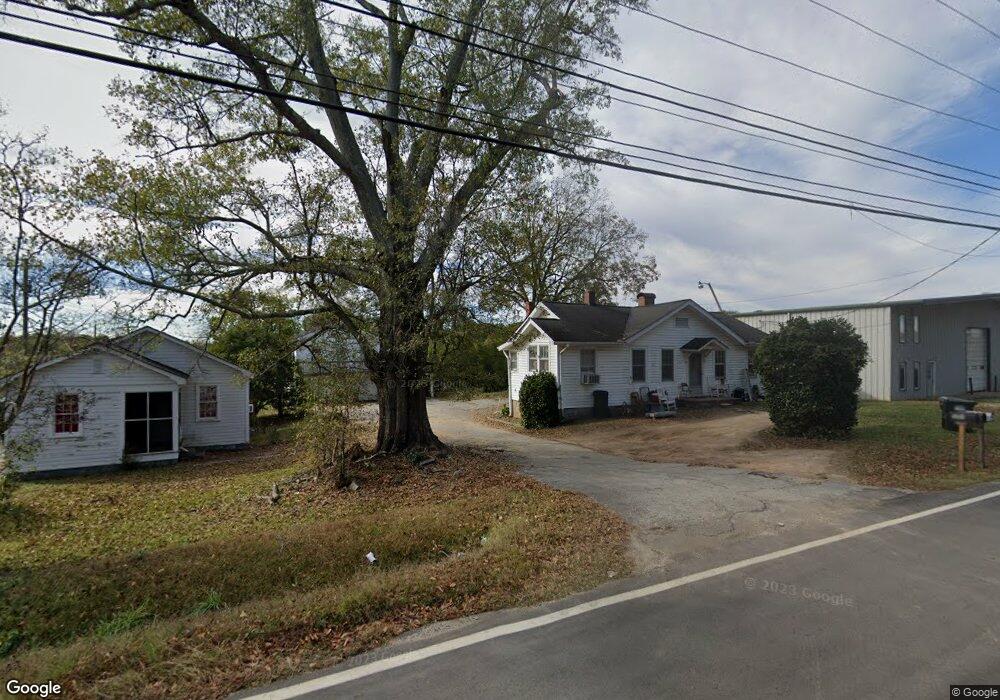
305 W Railroad St Elberton, GA 30635
Estimated Value: $170,000 - $212,000
--
Bed
1
Bath
1,262
Sq Ft
$148/Sq Ft
Est. Value
About This Home
This home is located at 305 W Railroad St, Elberton, GA 30635 and is currently estimated at $186,356, approximately $147 per square foot. 305 W Railroad St is a home located in Elbert County with nearby schools including Elbert County Elementary School, Elbert County Primary School, and Elbert County Middle School.
Ownership History
Date
Name
Owned For
Owner Type
Purchase Details
Closed on
May 19, 2022
Sold by
Rdcm Properties Llc
Bought by
Lavere John Allen and Lavere Agnes Marie
Current Estimated Value
Home Financials for this Owner
Home Financials are based on the most recent Mortgage that was taken out on this home.
Original Mortgage
$172,000
Outstanding Balance
$153,319
Interest Rate
4.72%
Mortgage Type
New Conventional
Estimated Equity
$33,037
Purchase Details
Closed on
Jun 4, 2015
Sold by
Dye Jane J
Bought by
Rdcm Properties Llc
Purchase Details
Closed on
Dec 18, 2013
Sold by
Dye Michael W and Dye Sandra J
Bought by
Dye Jane J Trustee Of The Sandra Jane Dy
Purchase Details
Closed on
May 1, 1993
Bought by
Dye Michael W and Dye Sandra J
Purchase Details
Closed on
Dec 1, 1986
Purchase Details
Closed on
Jan 1, 1950
Create a Home Valuation Report for This Property
The Home Valuation Report is an in-depth analysis detailing your home's value as well as a comparison with similar homes in the area
Home Values in the Area
Average Home Value in this Area
Purchase History
| Date | Buyer | Sale Price | Title Company |
|---|---|---|---|
| Lavere John Allen | $215,000 | -- | |
| Rdcm Properties Llc | $50,000 | -- | |
| Dye Jane J Trustee Of The Sandra Jane Dy | -- | -- | |
| Dye Michael W | $54,900 | -- | |
| -- | -- | -- | |
| -- | $1,100 | -- |
Source: Public Records
Mortgage History
| Date | Status | Borrower | Loan Amount |
|---|---|---|---|
| Open | Lavere John Allen | $172,000 |
Source: Public Records
Tax History Compared to Growth
Tax History
| Year | Tax Paid | Tax Assessment Tax Assessment Total Assessment is a certain percentage of the fair market value that is determined by local assessors to be the total taxable value of land and additions on the property. | Land | Improvement |
|---|---|---|---|---|
| 2024 | $1,688 | $68,627 | $7,954 | $60,673 |
| 2023 | $1,039 | $68,627 | $7,954 | $60,673 |
| 2022 | $1,398 | $56,807 | $7,954 | $48,853 |
| 2021 | $1,408 | $56,807 | $7,954 | $48,853 |
| 2020 | $1,196 | $43,359 | $7,954 | $35,405 |
| 2019 | $1,235 | $43,359 | $7,954 | $35,405 |
| 2018 | $1,262 | $43,359 | $7,954 | $35,405 |
| 2017 | $1,056 | $33,610 | $7,954 | $25,656 |
| 2016 | $365 | $33,610 | $7,954 | $25,656 |
| 2015 | -- | $33,610 | $7,954 | $25,656 |
| 2014 | -- | $35,639 | $7,954 | $27,685 |
| 2013 | -- | $35,639 | $7,954 | $27,685 |
Source: Public Records
Map
Nearby Homes
- 0 Pulliam St Unit 7659662
- 0 Pulliam St Unit 10616872
- 243 W Tate St
- 381 College Ave
- 89 College Ave
- 136 Forest Ave
- 345 N Oliver St
- 170 Lake Forest Dr
- 1020 Hickory Dr
- 346 N Oliver St
- 62 Oak St
- 108 Brookhaven Cir
- 1133 Kathwood Dr
- 968 Ext Elbert St
- 118 Oak Dr
- 0 Sara Jane Dr Unit 10501253
- 143 Lake Forest Cir
- 270 Dogwood Ln
- 0 Oak Dr Unit 7643600
- 0 Oak Dr Unit 10598083
- 318 W Railroad St
- 309 W Railroad St
- 311 W Railroad St
- 365 W Railroad St
- 367 W Railroad St
- 318 Highland Park Dr
- 732 Granite St
- 302 Highland Park
- 278 College Ave
- 272 College Ave
- 292 College Ave
- 203 Sunnyside Ave
- 296 College Ave
- 300 Highland Park
- 300 Highland Park
- 207 Sunnyside Ave
- 298 College Ave
- 286 Highland Park
- 290 Highland Park
- 305 Childs Ave