305 W Section St Claypool, IN 46510
Estimated Value: $109,000 - $216,000
2
Beds
1
Bath
1,872
Sq Ft
$82/Sq Ft
Est. Value
About This Home
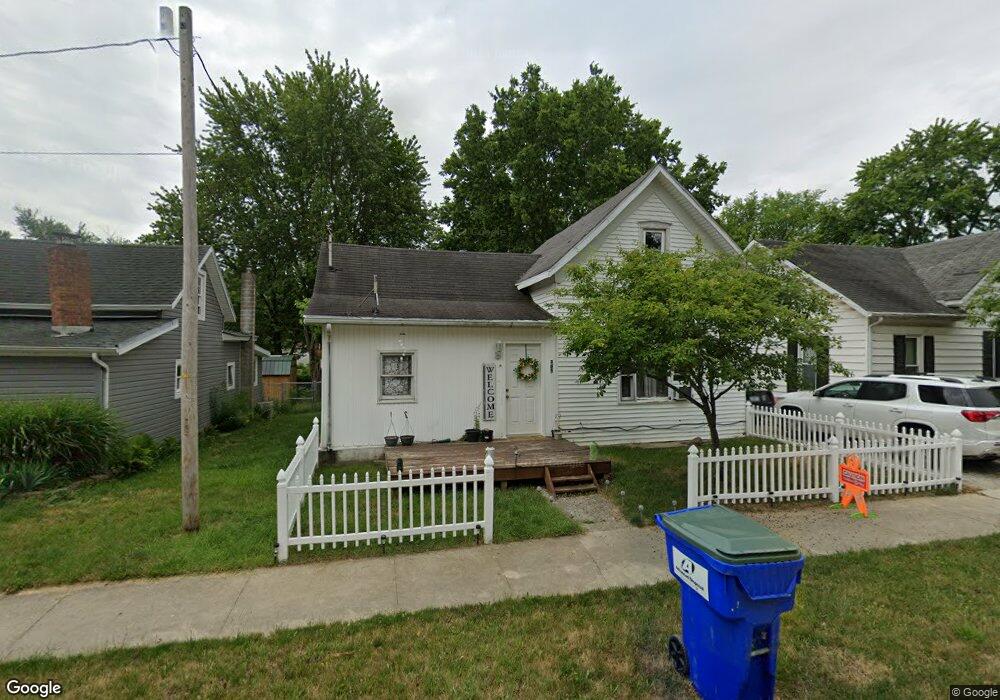
This home is located at 305 W Section St, Claypool, IN 46510 and is currently estimated at $153,388, approximately $81 per square foot. 305 W Section St is a home located in Kosciusko County with nearby schools including Claypool Elementary School, Edgewood Middle School, and Warsaw Community High School.
Ownership History
Date
Name
Owned For
Owner Type
Purchase Details
Closed on
Feb 10, 2021
Sold by
Forest Hill Investments Llc
Bought by
Gingerich Arlene
Current Estimated Value
Purchase Details
Closed on
Oct 31, 2018
Sold by
Tillberry Janice
Bought by
Forest Hill Investments Llc
Purchase Details
Closed on
Feb 9, 2017
Sold by
Nikxis Inc
Bought by
Janice Tillberry
Purchase Details
Closed on
Sep 24, 2015
Sold by
Albertson Allan L and Albertson Elaine
Bought by
Nikxis Inc
Home Financials for this Owner
Home Financials are based on the most recent Mortgage that was taken out on this home.
Original Mortgage
$113,000
Interest Rate
3.84%
Mortgage Type
Future Advance Clause Open End Mortgage
Purchase Details
Closed on
Oct 16, 1995
Sold by
Lee Mccord Norman
Bought by
Not Provided
Create a Home Valuation Report for This Property
The Home Valuation Report is an in-depth analysis detailing your home's value as well as a comparison with similar homes in the area
Home Values in the Area
Average Home Value in this Area
Purchase History
| Date | Buyer | Sale Price | Title Company |
|---|---|---|---|
| Gingerich Arlene | -- | None Available | |
| Forest Hill Investments Llc | -- | None Available | |
| Janice Tillberry | $25,000 | -- | |
| Tillberry Janice | $25,000 | Attorney | |
| Nikxis Inc | -- | Attorney | |
| Not Provided | $8,000 | -- |
Source: Public Records
Mortgage History
| Date | Status | Borrower | Loan Amount |
|---|---|---|---|
| Previous Owner | Nikxis Inc | $113,000 |
Source: Public Records
Tax History Compared to Growth
Tax History
| Year | Tax Paid | Tax Assessment Tax Assessment Total Assessment is a certain percentage of the fair market value that is determined by local assessors to be the total taxable value of land and additions on the property. | Land | Improvement |
|---|---|---|---|---|
| 2024 | $2,328 | $74,200 | $11,600 | $62,600 |
| 2023 | $1,480 | $66,600 | $6,900 | $59,700 |
| 2022 | $1,308 | $62,900 | $6,400 | $56,500 |
| 2021 | $1,212 | $58,000 | $6,400 | $51,600 |
| 2020 | $1,192 | $57,500 | $6,400 | $51,100 |
| 2019 | $1,204 | $57,500 | $6,400 | $51,100 |
| 2018 | $291 | $47,700 | $6,400 | $41,300 |
| 2017 | $253 | $43,400 | $6,400 | $37,000 |
| 2016 | $878 | $40,500 | $5,000 | $35,500 |
| 2014 | $912 | $45,600 | $5,000 | $40,600 |
| 2013 | $912 | $45,600 | $5,000 | $40,600 |
Source: Public Records
Map
Nearby Homes
- 102 S Main St
- 105 E Section St
- 204 S Graceland Ave
- 7180 S 425 W
- 8920 S Merry Estates Dr
- 8727 S Hill Dr
- ** W Hoppus Rd
- * W Hoppus Rd
- 4239 S Kinsey Rd
- 5439 W Warren St
- 5445 W Warren St
- 1016 S Roosevelt St
- 5925 W 850 S
- 706 W Neher Rd
- 36.65 Acres Indiana 14
- 202 E Main St
- 4280 S Scott Rd
- 408 E Sycamore St
- 4271 S Mallard Rd
- 1895 E 800 S
- 303 W Section St
- 307 W Section St
- 302 W Section St
- ** W 700 S
- ***** W 700 S
- 304 W Section St
- 306 W Section St
- 2501 W 700 S Unit (Section Street)
- 2501 W 700 S
- 205 W Section St
- 105 S Clay St
- 208 W Section St
- 202 S Clay St
- S S 200 W
- 107 N Clay St
- 208 W Calhoun St
- 106 N Clay St
- 203 W Section St
- 206 W Section St
- 404 W Section St Unit West edge of Claypoo