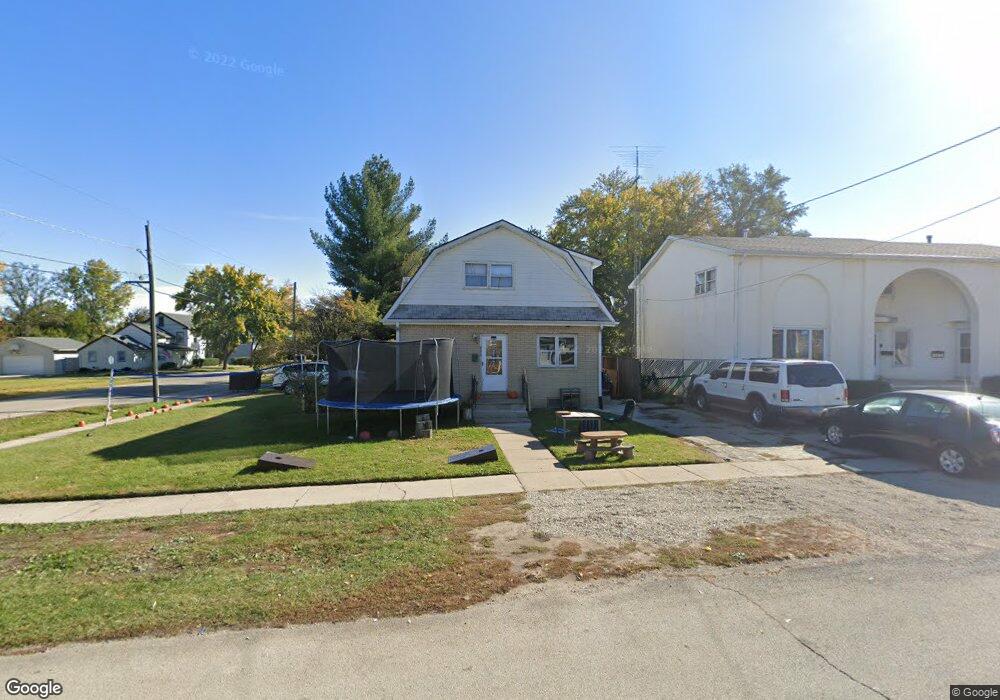
305 W Van Buren St Marengo, IL 60152
Estimated Value: $291,452 - $393,000
6
Beds
6
Baths
--
Sq Ft
6,534
Sq Ft Lot
About This Home
This home is located at 305 W Van Buren St, Marengo, IL 60152 and is currently estimated at $328,863. 305 W Van Buren St is a home located in McHenry County with nearby schools including Locust Elementary School, Marengo Community Middle School, and Marengo Community High School.
Ownership History
Date
Name
Owned For
Owner Type
Purchase Details
Closed on
Nov 23, 2022
Sold by
M Lp Llc
Bought by
Rep Properties Llc
Current Estimated Value
Purchase Details
Closed on
Mar 29, 2011
Sold by
Luna
Bought by
Mlp Llc
Purchase Details
Closed on
Nov 2, 2006
Sold by
Sieben Terry B and Sieben Vergene M
Bought by
Luna Erik
Home Financials for this Owner
Home Financials are based on the most recent Mortgage that was taken out on this home.
Original Mortgage
$58,900
Interest Rate
6.36%
Mortgage Type
Stand Alone Second
Purchase Details
Closed on
Aug 31, 2005
Sold by
Kraus Richard W and Kraus Sherry A
Bought by
Sieben Terry B and Sieben Vergene M
Home Financials for this Owner
Home Financials are based on the most recent Mortgage that was taken out on this home.
Original Mortgage
$212,000
Interest Rate
6.5%
Mortgage Type
Fannie Mae Freddie Mac
Create a Home Valuation Report for This Property
The Home Valuation Report is an in-depth analysis detailing your home's value as well as a comparison with similar homes in the area
Home Values in the Area
Average Home Value in this Area
Purchase History
| Date | Buyer | Sale Price | Title Company |
|---|---|---|---|
| Rep Properties Llc | -- | None Listed On Document | |
| Rep Properties Llc | -- | -- | |
| Mlp Llc | $85,307 | None Available | |
| Luna Erik | $294,500 | Fatic | |
| Sieben Terry B | $265,000 | Multiple |
Source: Public Records
Mortgage History
| Date | Status | Borrower | Loan Amount |
|---|---|---|---|
| Previous Owner | Luna Erik | $58,900 | |
| Previous Owner | Luna Erik | $235,600 | |
| Previous Owner | Sieben Terry B | $212,000 |
Source: Public Records
Tax History Compared to Growth
Tax History
| Year | Tax Paid | Tax Assessment Tax Assessment Total Assessment is a certain percentage of the fair market value that is determined by local assessors to be the total taxable value of land and additions on the property. | Land | Improvement |
|---|---|---|---|---|
| 2024 | $6,017 | $79,295 | $22,290 | $57,005 |
| 2023 | $5,911 | $69,900 | $19,649 | $50,251 |
| 2022 | $5,670 | $63,212 | $17,769 | $45,443 |
| 2021 | $5,307 | $57,596 | $16,190 | $41,406 |
| 2020 | $5,235 | $54,811 | $15,407 | $39,404 |
| 2019 | $5,558 | $51,934 | $14,598 | $37,336 |
| 2018 | $5,184 | $48,646 | $13,674 | $34,972 |
| 2017 | $5,040 | $46,080 | $12,953 | $33,127 |
| 2016 | $4,903 | $43,053 | $12,102 | $30,951 |
| 2013 | -- | $36,227 | $11,841 | $24,386 |
Source: Public Records
Map
Nearby Homes
- 212 E Van Buren St
- 906 N State St
- 830 N Taylor St
- 704 Echo (Lot 21) Trail
- 806 Echo (Lot 22) Trail
- 7 ACRES Menge Rd
- 802 Echo (Lot 23) Trail
- 422 Damen St
- 1101 N State St
- 21820 W Railroad St
- 622 Telegraph St
- 102 6th Ave
- 10 ac U S 20
- 713 Walnut Ln
- 455 Park Dr
- 832 Oak Manor Dr
- 459 Kennedy St
- 00 Maple St
- 479 Kennedy St
- 860 Woodland Ct
- 229 N Ford St
- 241 N Ford St
- 240 N Ann St
- 236 N Ford St
- 234 N Ann St
- 304 W Van Buren St
- 306 W Van Buren St
- 220 N Ann St
- 219 N Ford St
- 302 W Van Buren St
- 220 N Ford St
- 311 W Van Buren St
- 218 N Ann St
- 312 W Van Buren St
- 204 W Van Buren St
- 207 N Ford St
- 318 W Van Buren St
- 216 N Ann St
- 216 N Ann St
- 121 W Van Buren St