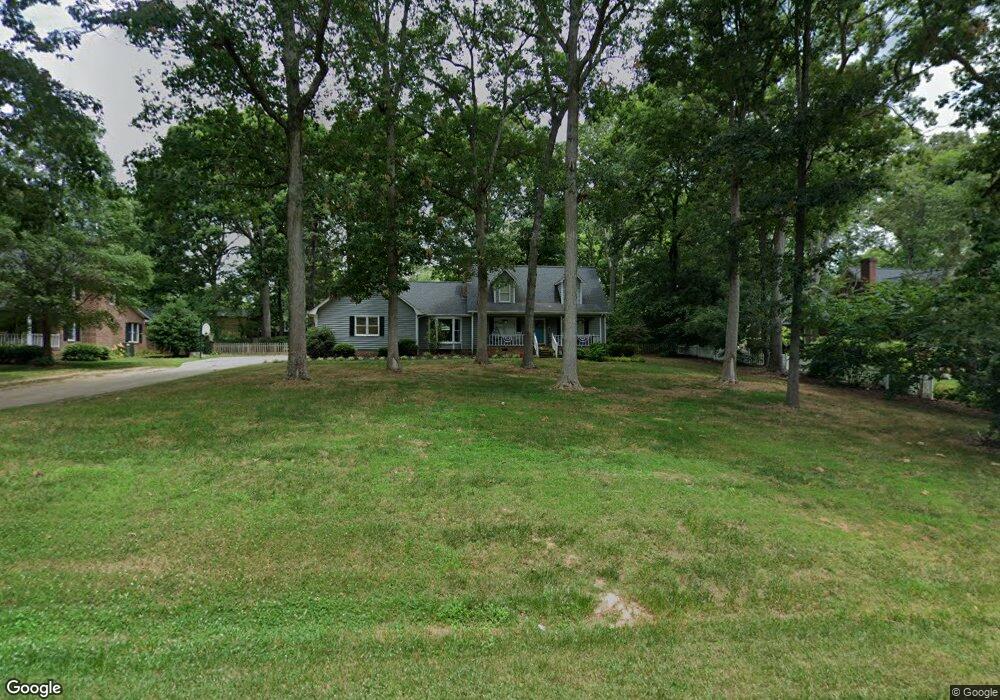
305 Walnut Dr Asheboro, NC 27205
Estimated Value: $346,484 - $445,000
--
Bed
3
Baths
2,063
Sq Ft
$189/Sq Ft
Est. Value
About This Home
This home is located at 305 Walnut Dr, Asheboro, NC 27205 and is currently estimated at $390,871, approximately $189 per square foot. 305 Walnut Dr is a home located in Randolph County with nearby schools including Sycamore Elementary School, Southmont Elementary School, and Southwestern Randolph Middle School.
Ownership History
Date
Name
Owned For
Owner Type
Purchase Details
Closed on
Oct 29, 2022
Sold by
Shue Daniel Grey and Shue Angela
Bought by
Hall Christopher and Hall Angela
Current Estimated Value
Home Financials for this Owner
Home Financials are based on the most recent Mortgage that was taken out on this home.
Original Mortgage
$294,668
Outstanding Balance
$285,480
Interest Rate
6.92%
Mortgage Type
FHA
Estimated Equity
$105,391
Purchase Details
Closed on
Jun 2, 2017
Sold by
Younts Timothy L and Younts Lou Anne H
Bought by
Wilhoit Shue Daniel Grey and Wilhoit Shue Angela
Home Financials for this Owner
Home Financials are based on the most recent Mortgage that was taken out on this home.
Original Mortgage
$204,250
Interest Rate
4.03%
Mortgage Type
New Conventional
Purchase Details
Closed on
Jul 21, 1989
Bought by
Younts Timothy L Younts Lou Ann
Purchase Details
Closed on
Jun 14, 1989
Bought by
Younts Timothy L Younts Lou Ann
Create a Home Valuation Report for This Property
The Home Valuation Report is an in-depth analysis detailing your home's value as well as a comparison with similar homes in the area
Home Values in the Area
Average Home Value in this Area
Purchase History
| Date | Buyer | Sale Price | Title Company |
|---|---|---|---|
| Hall Christopher | -- | -- | |
| Wilhoit Shue Daniel Grey | $215,000 | None Available | |
| Younts Timothy L Younts Lou Ann | $11,000 | -- | |
| Younts Timothy L Younts Lou Ann | $11,000 | -- |
Source: Public Records
Mortgage History
| Date | Status | Borrower | Loan Amount |
|---|---|---|---|
| Open | Hall Christopher | $294,668 | |
| Previous Owner | Wilhoit Shue Daniel Grey | $204,250 |
Source: Public Records
Tax History Compared to Growth
Tax History
| Year | Tax Paid | Tax Assessment Tax Assessment Total Assessment is a certain percentage of the fair market value that is determined by local assessors to be the total taxable value of land and additions on the property. | Land | Improvement |
|---|---|---|---|---|
| 2025 | $1,578 | $253,680 | $47,520 | $206,160 |
| 2024 | $1,578 | $253,680 | $47,520 | $206,160 |
| 2023 | $1,578 | $253,680 | $47,520 | $206,160 |
| 2022 | $1,332 | $176,310 | $28,630 | $147,680 |
| 2021 | $1,332 | $176,310 | $28,630 | $147,680 |
| 2020 | $1,279 | $176,310 | $28,630 | $147,680 |
| 2019 | $1,279 | $176,310 | $28,630 | $147,680 |
| 2018 | $1,377 | $184,970 | $24,820 | $160,150 |
| 2016 | $1,340 | $184,969 | $24,820 | $160,149 |
| 2015 | $1,345 | $184,969 | $24,820 | $160,149 |
| 2014 | -- | $184,969 | $24,820 | $160,149 |
Source: Public Records
Map
Nearby Homes
- 6015 Zoo Pkwy
- 6009 Zoo Pkwy
- 0 Lisbon Rd
- 3162 Montclair Ct
- Promenade Plan at The Villas at Pinewood
- Portico Plan at The Villas at Pinewood
- Torino Plan at The Villas at Pinewood
- Wellington Plan at The Villas at Pinewood
- 167 Drum St
- 0 Ross Harris
- 708 Dawson Miller Rd
- 214 Vancroft St
- 916 S Creek Ct
- 5979 US Highway 220 S
- 4149 Happy Hollow Rd
- 197 Copples Rd
- 4263 Zoo Pkwy
- 4240 Nc Highway 134
- 00 Route 220 Hwy
- 116 Bullins Ln
- 327 Walnut Dr
- 297 Walnut Dr
- 00 Greenview Dr
- 713 Greenview Dr
- 316 Walnut Dr
- 292 Walnut Dr
- 2594 Hickory Dr
- 330 Walnut Dr
- 346 Walnut Dr
- 2604 Hickory Dr
- 2555 Hickory Dr
- 835 Greenview Dr
- 2581 Hickory Dr
- 358 Walnut Dr
- 587 Greenview Dr
- 347 Brantley Dr
- 361 Walnut Dr
- 2601 Hickory Dr
- 367 Brantley Dr
- 2615 Hickory Dr