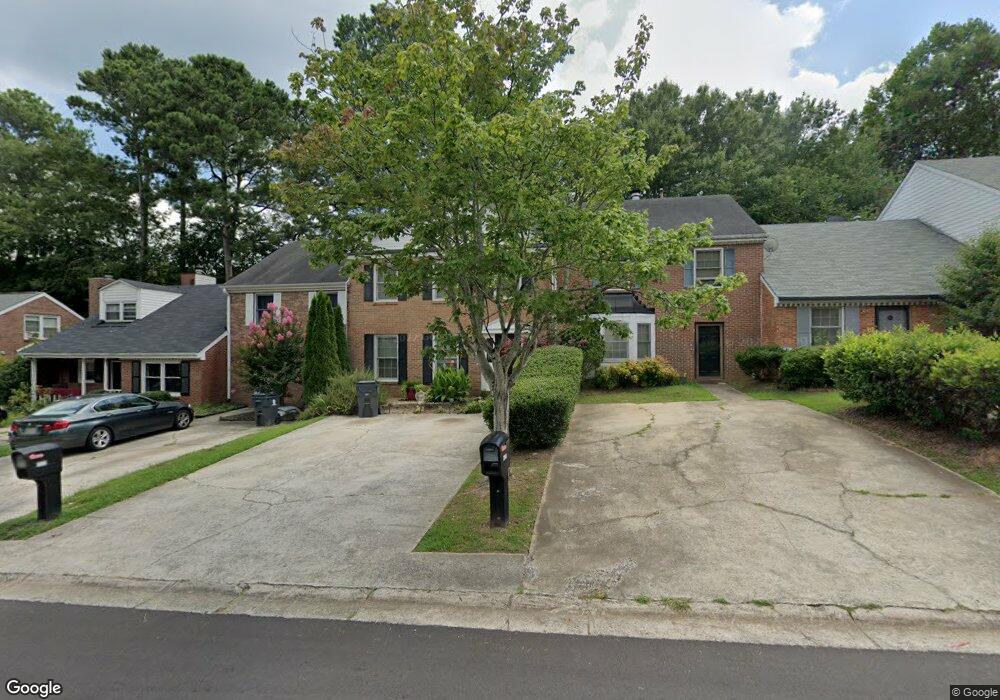
305 Williamsburg Way Fayetteville, GA 30214
Estimated Value: $211,000 - $242,361
3
Beds
3
Baths
1,402
Sq Ft
$159/Sq Ft
Est. Value
About This Home
This home is located at 305 Williamsburg Way, Fayetteville, GA 30214 and is currently estimated at $223,340, approximately $159 per square foot. 305 Williamsburg Way is a home located in Fayette County with nearby schools including Spring Hill Elementary School, Bennett's Mill Middle School, and Fayette County High School.
Ownership History
Date
Name
Owned For
Owner Type
Purchase Details
Closed on
Apr 27, 2017
Sold by
Lord Richard Shannon
Bought by
Johnson Tameca
Current Estimated Value
Home Financials for this Owner
Home Financials are based on the most recent Mortgage that was taken out on this home.
Original Mortgage
$104,080
Outstanding Balance
$86,603
Interest Rate
4.12%
Mortgage Type
FHA
Estimated Equity
$136,737
Purchase Details
Closed on
Dec 19, 2015
Sold by
Lord Michael Bass
Bought by
Lord Richard S
Purchase Details
Closed on
Apr 27, 1998
Sold by
Davis Mona L
Bought by
Lord Richard
Purchase Details
Closed on
Nov 29, 1994
Sold by
Tenney Andrew Anne
Bought by
Brown Mona
Home Financials for this Owner
Home Financials are based on the most recent Mortgage that was taken out on this home.
Original Mortgage
$64,622
Interest Rate
8.82%
Mortgage Type
FHA
Create a Home Valuation Report for This Property
The Home Valuation Report is an in-depth analysis detailing your home's value as well as a comparison with similar homes in the area
Home Values in the Area
Average Home Value in this Area
Purchase History
| Date | Buyer | Sale Price | Title Company |
|---|---|---|---|
| Johnson Tameca | $106,000 | -- | |
| Lord Richard S | -- | -- | |
| Lord Richard | $90,000 | -- | |
| Brown Mona | $65,000 | -- |
Source: Public Records
Mortgage History
| Date | Status | Borrower | Loan Amount |
|---|---|---|---|
| Open | Johnson Tameca | $104,080 | |
| Previous Owner | Brown Mona | $64,622 |
Source: Public Records
Tax History Compared to Growth
Tax History
| Year | Tax Paid | Tax Assessment Tax Assessment Total Assessment is a certain percentage of the fair market value that is determined by local assessors to be the total taxable value of land and additions on the property. | Land | Improvement |
|---|---|---|---|---|
| 2024 | $1,583 | $85,168 | $15,520 | $69,648 |
| 2023 | $937 | $69,160 | $15,520 | $53,640 |
| 2022 | $1,343 | $60,880 | $10,000 | $50,880 |
| 2021 | $1,220 | $50,320 | $10,000 | $40,320 |
| 2020 | $1,420 | $47,960 | $8,000 | $39,960 |
| 2019 | $1,205 | $40,640 | $8,000 | $32,640 |
| 2018 | $1,127 | $37,760 | $6,000 | $31,760 |
| 2017 | $1,036 | $34,640 | $6,000 | $28,640 |
| 2016 | $947 | $31,000 | $6,000 | $25,000 |
| 2015 | $964 | $31,000 | $9,600 | $21,400 |
| 2014 | $917 | $28,920 | $9,600 | $19,320 |
| 2013 | -- | $28,760 | $0 | $0 |
Source: Public Records
Map
Nearby Homes
- 415 Williamsburg Way
- 170 Woodstream Way Unit B
- 235 Woodstream Way
- The Mildred Plan at Mitchell Estates
- The Bradford Plan at Mitchell Estates
- 115 Linda Way
- 110 Lindsey Terrace
- 665 Beauregard Blvd
- 110 Sparrows Cove
- 4010 Diane Ln
- 4080 Diane Ln
- 150 Reese St
- 140 Reese St
- 130 Reese St
- 295 Cobalt Dr
- 315 Cobalt Dr
- 130 Thrushwood Dr
- 315 Enchanted Ct
- 315 Ivanhoe Dr
- 315 Walker Ave
- 295 Williamsburg Way
- 315 Williamsburg Way
- 315 Williamsburg Way Unit 22B
- 285 Williamsburg Way
- 350 High St
- 325 Williamsburg Way
- 275 Williamsburg Way
- 275 Williamsburg Way Unit 275
- 335 Williamsburg Way
- 265 Williamsburg Way
- 265 Williamsburg Way Unit 1
- 345 Williamsburg Way
- 255 Williamsburg Way
- 355 Williamsburg Way
- 280 Williamsburg Way
- 270 Williamsburg Way
- 290 Williamsburg Way
- 290 Williamsburg Way Unit 290
- 260 Williamsburg Way
- 300 Williamsburg Way