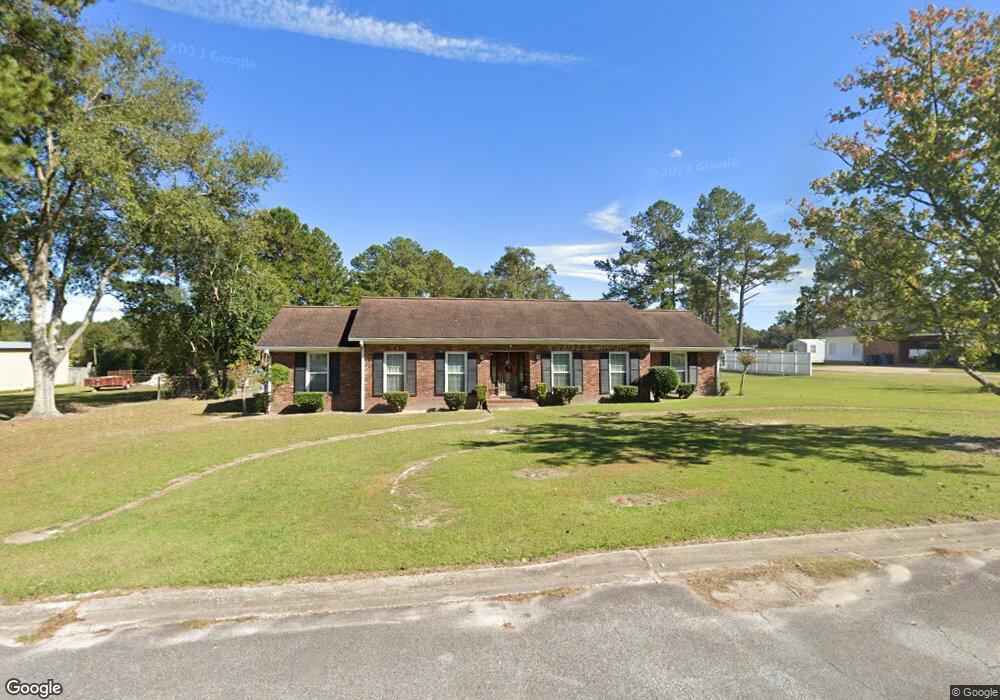
3050 Ash Dr Waycross, GA 31501
Estimated Value: $232,805 - $259,000
--
Bed
2
Baths
2,210
Sq Ft
$112/Sq Ft
Est. Value
About This Home
This home is located at 3050 Ash Dr, Waycross, GA 31501 and is currently estimated at $248,451, approximately $112 per square foot. 3050 Ash Dr is a home located in Ware County with nearby schools including Wacona Elementary School, Ware County Middle School, and Ware County High School.
Ownership History
Date
Name
Owned For
Owner Type
Purchase Details
Closed on
Dec 2, 2005
Sold by
Crosby Gary Stephen
Bought by
Crosby Gary Stephen and Crosby Leslie Bennett
Current Estimated Value
Purchase Details
Closed on
Feb 26, 1993
Bought by
Crosby Gary Stephen
Purchase Details
Closed on
Dec 10, 1992
Bought by
Crosby Tom
Create a Home Valuation Report for This Property
The Home Valuation Report is an in-depth analysis detailing your home's value as well as a comparison with similar homes in the area
Home Values in the Area
Average Home Value in this Area
Purchase History
| Date | Buyer | Sale Price | Title Company |
|---|---|---|---|
| Crosby Gary Stephen | -- | -- | |
| Crosby Gary Stephen | $70,000 | -- | |
| Crosby Tom | $70,000 | -- |
Source: Public Records
Tax History Compared to Growth
Tax History
| Year | Tax Paid | Tax Assessment Tax Assessment Total Assessment is a certain percentage of the fair market value that is determined by local assessors to be the total taxable value of land and additions on the property. | Land | Improvement |
|---|---|---|---|---|
| 2024 | $1,132 | $87,374 | $7,420 | $79,954 |
| 2023 | $1,154 | $73,160 | $8,311 | $64,849 |
| 2022 | $1,301 | $73,160 | $8,311 | $64,849 |
| 2021 | $1,363 | $58,516 | $8,311 | $50,205 |
| 2020 | $1,378 | $56,885 | $8,311 | $48,574 |
| 2019 | $1,276 | $47,795 | $8,311 | $39,484 |
| 2018 | $1,261 | $46,232 | $8,311 | $37,921 |
| 2017 | $1,237 | $44,855 | $8,311 | $36,544 |
| 2016 | $1,237 | $44,855 | $8,311 | $36,544 |
| 2015 | $1,249 | $44,855 | $8,311 | $36,544 |
| 2014 | $1,247 | $44,856 | $8,311 | $36,544 |
| 2013 | -- | $44,855 | $8,311 | $36,544 |
Source: Public Records
Map
Nearby Homes