Estimated Value: $233,192 - $253,000
3
Beds
2
Baths
1,512
Sq Ft
$163/Sq Ft
Est. Value
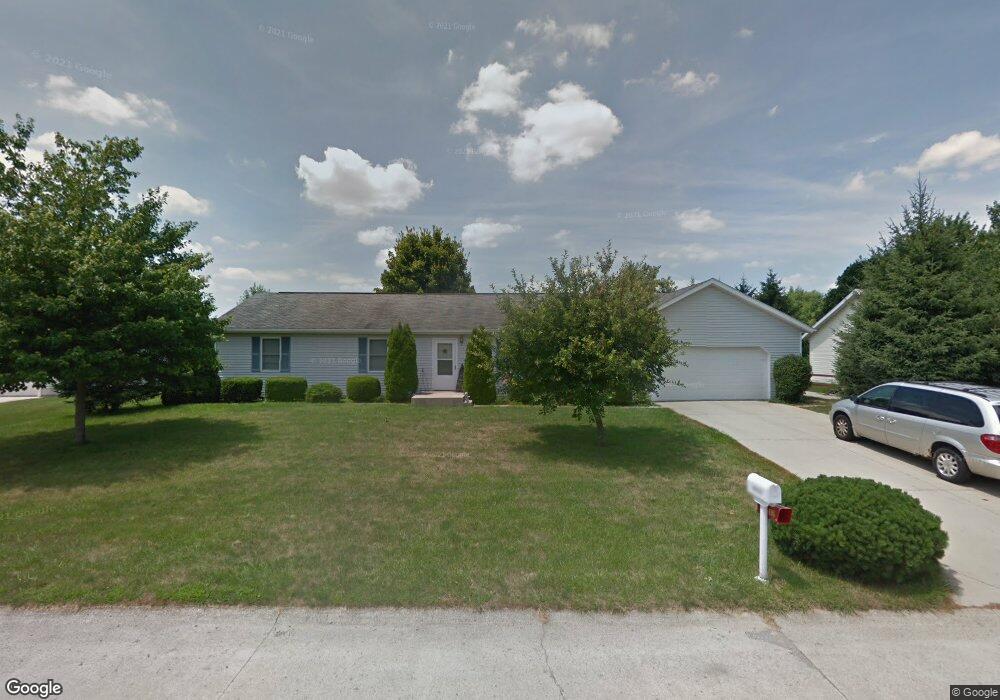
About This Home
This home is located at 3050 Pro Dr, Lima, OH 45806 and is currently estimated at $245,798, approximately $162 per square foot. 3050 Pro Dr is a home located in Allen County with nearby schools including Elmwood Elementary School, Maplewood Elementary School, and Shawnee Middle School.
Ownership History
Date
Name
Owned For
Owner Type
Purchase Details
Closed on
Aug 28, 2015
Sold by
Cassell Donna M
Bought by
Nguyen Mai T and Nguyen Duc
Current Estimated Value
Home Financials for this Owner
Home Financials are based on the most recent Mortgage that was taken out on this home.
Original Mortgage
$110,000
Outstanding Balance
$86,925
Interest Rate
4.09%
Mortgage Type
New Conventional
Estimated Equity
$158,873
Purchase Details
Closed on
Mar 2, 2010
Sold by
Hall Mary Kathryn
Bought by
Cassell Hobart G and Cassell Donna M
Home Financials for this Owner
Home Financials are based on the most recent Mortgage that was taken out on this home.
Original Mortgage
$70,400
Interest Rate
3.37%
Mortgage Type
Adjustable Rate Mortgage/ARM
Purchase Details
Closed on
Apr 21, 1994
Sold by
Miller Cheryl R
Bought by
Deidrick Kenneth
Purchase Details
Closed on
Apr 25, 1990
Bought by
Miller Cheryl R
Create a Home Valuation Report for This Property
The Home Valuation Report is an in-depth analysis detailing your home's value as well as a comparison with similar homes in the area
Home Values in the Area
Average Home Value in this Area
Purchase History
| Date | Buyer | Sale Price | Title Company |
|---|---|---|---|
| Nguyen Mai T | $120,000 | None Available | |
| Cassell Hobart G | $88,000 | Attorney | |
| Deidrick Kenneth | $8,500 | -- | |
| Miller Cheryl R | $24,800 | -- |
Source: Public Records
Mortgage History
| Date | Status | Borrower | Loan Amount |
|---|---|---|---|
| Open | Nguyen Mai T | $110,000 | |
| Previous Owner | Cassell Hobart G | $70,400 |
Source: Public Records
Tax History
| Year | Tax Paid | Tax Assessment Tax Assessment Total Assessment is a certain percentage of the fair market value that is determined by local assessors to be the total taxable value of land and additions on the property. | Land | Improvement |
|---|---|---|---|---|
| 2024 | $2,962 | $60,340 | $11,060 | $49,280 |
| 2023 | $2,742 | $49,080 | $9,000 | $40,080 |
| 2022 | $2,762 | $49,080 | $9,000 | $40,080 |
| 2021 | $2,756 | $49,080 | $9,000 | $40,080 |
| 2020 | $2,042 | $42,180 | $8,610 | $33,570 |
| 2019 | $2,042 | $42,180 | $8,610 | $33,570 |
| 2018 | $1,964 | $42,180 | $8,610 | $33,570 |
| 2017 | $1,883 | $37,800 | $8,610 | $29,190 |
| 2016 | $1,869 | $37,800 | $8,610 | $29,190 |
| 2015 | $1,904 | $37,800 | $8,610 | $29,190 |
| 2014 | $1,904 | $37,140 | $8,510 | $28,630 |
| 2013 | $2,020 | $37,140 | $8,510 | $28,630 |
Source: Public Records
Map
Nearby Homes
- 2632 Alexandria Dr
- 2975 Zurmehly Rd
- 2529 Struthmore Dr
- 4039 Magnolia
- 3500 Weldon Dr
- 2160 Grimmwood Dr
- 3349 Weldon Dr
- 3337 Weldon Dr
- 3323 Weldon Dr
- 3363 Weldon Dr
- 3372 Weldon Dr
- 3346 Weldon Dr
- 3332 Weldon Dr
- 3320 Weldon Dr
- 3398 Weldon Dr
- 3358 Weldon Dr
- 3386 Weldon Dr
- 3135 Juliette Dr
- 2852 Riverwalk Blvd Unit 2852
- 2977 Pine Grove Way
Your Personal Tour Guide
Ask me questions while you tour the home.