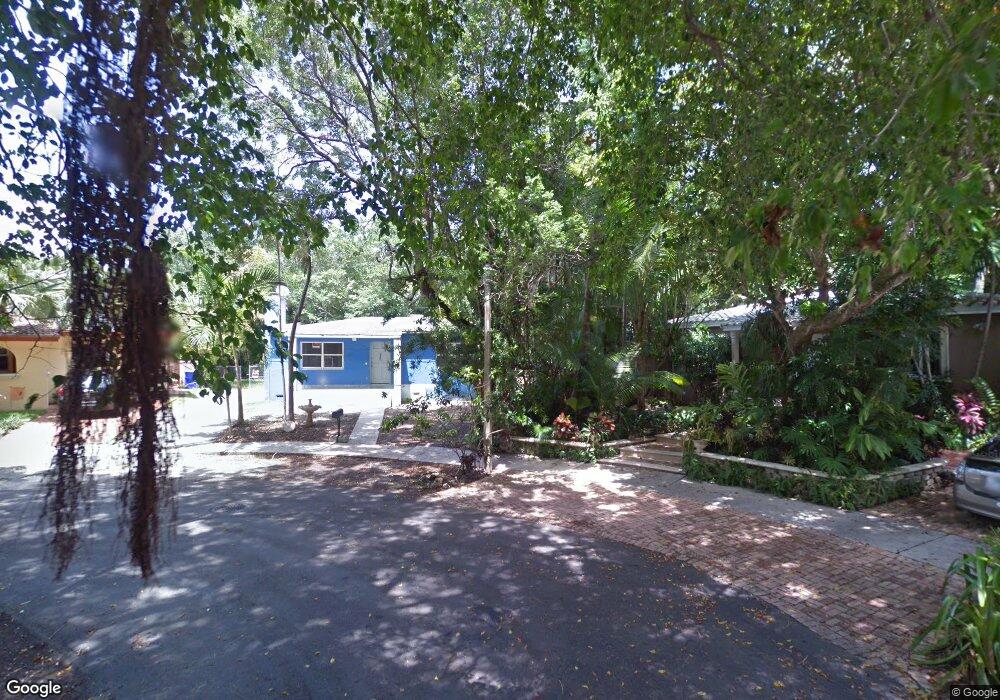
3051 Lime Ct Miami, FL 33133
Northeast Coconut Grove NeighborhoodEstimated Value: $1,109,000 - $1,334,000
2
Beds
1
Bath
1,084
Sq Ft
$1,127/Sq Ft
Est. Value
About This Home
This home is located at 3051 Lime Ct, Miami, FL 33133 and is currently estimated at $1,222,019, approximately $1,127 per square foot. 3051 Lime Ct is a home located in Miami-Dade County with nearby schools including Coconut Grove Elementary School, Ponce de Leon Middle School, and Coral Gables Senior High School.
Ownership History
Date
Name
Owned For
Owner Type
Purchase Details
Closed on
Apr 1, 2024
Sold by
Pedraza Jorge I
Bought by
Pedraza Jorge I and Jorge I Pedraza Revocable Trust
Current Estimated Value
Purchase Details
Closed on
Jan 18, 2019
Sold by
Mst Corp
Bought by
Pedraza Jorge and Pedraza Veronica
Purchase Details
Closed on
Aug 28, 2018
Sold by
Robertson Alvin Neil
Bought by
Mst Corp
Purchase Details
Closed on
Dec 29, 2014
Sold by
Robertson Alvin Neil and Robertson Laura Shoemaker
Bought by
Berlanga Leynier and Alonso Aida
Purchase Details
Closed on
Jan 9, 2006
Sold by
Robertson Joan L
Bought by
Robertson Alvin Neil and Robertson Laura
Purchase Details
Closed on
Jun 4, 2002
Sold by
Rene Morales I
Bought by
Robertson Joan L
Purchase Details
Closed on
Feb 1, 2000
Sold by
Robert E Cullen Tr and Carol A Cullen Tr
Bought by
Clavijo Sandra
Purchase Details
Closed on
Aug 31, 1993
Sold by
Cullen Robert E and Cullen Carol A
Bought by
Cullen Robert E
Create a Home Valuation Report for This Property
The Home Valuation Report is an in-depth analysis detailing your home's value as well as a comparison with similar homes in the area
Home Values in the Area
Average Home Value in this Area
Purchase History
| Date | Buyer | Sale Price | Title Company |
|---|---|---|---|
| Pedraza Jorge I | -- | None Listed On Document | |
| Pedraza Jorge I | -- | None Listed On Document | |
| Pedraza Jorge I | -- | None Listed On Document | |
| Pedraza Jorge | $613,000 | Attorney | |
| Mst Corp | $600,100 | None Available | |
| Berlanga Leynier | -- | None Available | |
| Robertson Alvin Neil | -- | None Available | |
| Robertson Joan L | $270,000 | -- | |
| Clavijo Sandra | $165,000 | -- | |
| Cullen Robert E | -- | -- |
Source: Public Records
Tax History
| Year | Tax Paid | Tax Assessment Tax Assessment Total Assessment is a certain percentage of the fair market value that is determined by local assessors to be the total taxable value of land and additions on the property. | Land | Improvement |
|---|---|---|---|---|
| 2025 | $9,919 | $532,925 | -- | -- |
| 2024 | $9,856 | $517,906 | -- | -- |
| 2023 | $9,856 | $502,822 | $0 | $0 |
| 2022 | $9,578 | $488,177 | $0 | $0 |
| 2021 | $9,563 | $473,959 | $0 | $0 |
| 2020 | $9,448 | $467,416 | $0 | $0 |
| 2019 | $10,247 | $462,247 | $382,203 | $80,044 |
| 2018 | $8,455 | $427,513 | $347,458 | $80,055 |
| 2017 | $9,220 | $459,035 | $0 | $0 |
| 2016 | $9,284 | $449,594 | $0 | $0 |
| 2015 | $8,902 | $383,288 | $0 | $0 |
| 2014 | $6,108 | $252,188 | $0 | $0 |
Source: Public Records
Map
Nearby Homes
- 3222 Matilda St Unit 3222
- 3197 Virginia St
- 3034 Oak Ave Unit 404
- 3034 Oak Ave Unit 508
- 3034 Oak Ave Unit 408
- 3034 Oak Ave Unit LPH4
- 3304 Virginia St Unit 4A
- 3304 Virginia St Unit 6C
- 3304 Virginia St Unit 6B
- 2940 Oak Ave
- 2924 Day Ave Unit N211
- 3124 Jackson Ave Unit 1
- 3339 Virginia St Unit 305
- 3101 Grand Ave Unit 209
- 3101 Grand Ave Unit 307
- 3242 Mary St Unit S215
- 3240 Mary St Unit S207
- 3076 McDonald St Unit B
- 3318 Day Ave Unit 7
- 3130 Bird Ave Unit 12
- 3061 Lime Ct
- 3030 Day Ave Unit 3030
- 3050 Lime Ct
- 3028 Day Ave
- 3028 Day Ave Unit 3028
- 3071 Lime Ct
- 3046 Day Ave
- 3046 Day Ave
- 3052 Day Ave Unit 2
- 3060 Lime Ct
- 3050 Day Ave
- 3050 Day Ave Unit 1
- 3050 Day Ave Unit 3050
- 3050 Day Ave Unit 3052
- 3050 Day Ave
- 3248 Virginia St Unit 3248
- 3248 Virginia St
- 3020 Day Ave Unit 3020
- 3062 Lime Ct Unit 3062
- 3024 Day Ave Unit 3024
Your Personal Tour Guide
Ask me questions while you tour the home.