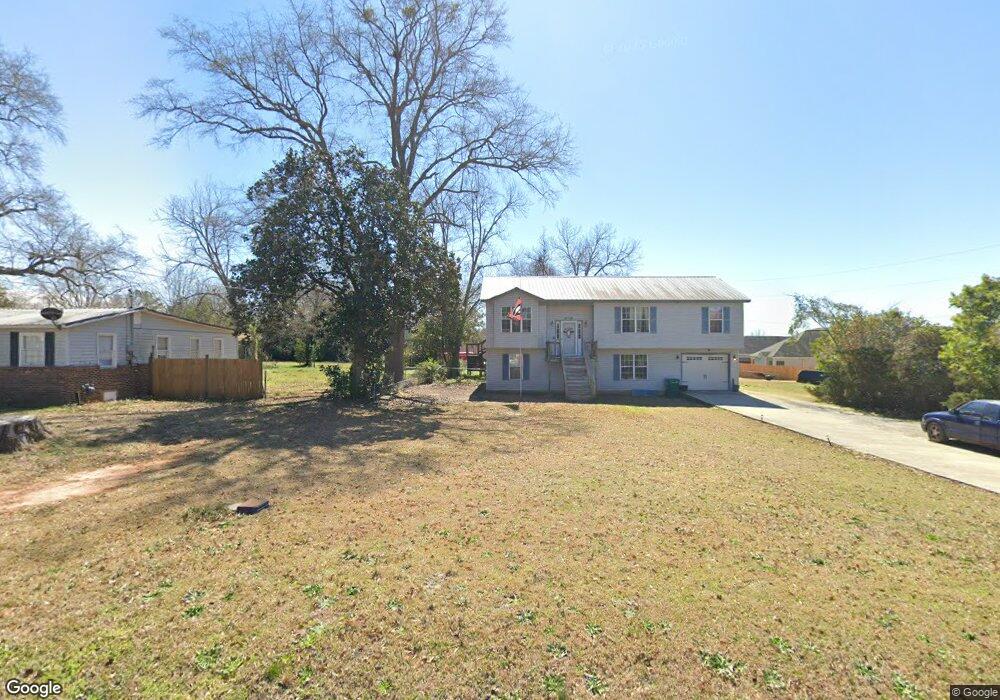
3051 Mason Dr Warner Robins, GA 31093
Estimated Value: $218,000 - $251,000
3
Beds
3
Baths
2,250
Sq Ft
$103/Sq Ft
Est. Value
About This Home
This home is located at 3051 Mason Dr, Warner Robins, GA 31093 and is currently estimated at $232,191, approximately $103 per square foot. 3051 Mason Dr is a home located in Houston County with nearby schools including Westside Elementary School, Northside Middle School, and Northside High School.
Ownership History
Date
Name
Owned For
Owner Type
Purchase Details
Closed on
Mar 28, 2024
Sold by
Blitch David Eugene and Blitch Janet Lynn
Bought by
Blitch Brandon Wesley and Barkwell Crystal Blitch
Current Estimated Value
Purchase Details
Closed on
Jul 28, 1987
Sold by
Bell Nancy
Bought by
Blitch David E and Janet L*
Purchase Details
Closed on
Jan 22, 1987
Sold by
Bell Ronald O
Bought by
Bell Nancy
Purchase Details
Closed on
Sep 21, 1973
Sold by
Berlin Venix and Berlin Wanda J
Bought by
Bell Ronald O
Purchase Details
Closed on
Jan 23, 1968
Sold by
Edwards William F
Bought by
Berlin Venix and Berlin Wanda J
Purchase Details
Closed on
Dec 10, 1958
Sold by
Corrective Deed
Bought by
Edwards William F
Create a Home Valuation Report for This Property
The Home Valuation Report is an in-depth analysis detailing your home's value as well as a comparison with similar homes in the area
Home Values in the Area
Average Home Value in this Area
Purchase History
| Date | Buyer | Sale Price | Title Company |
|---|---|---|---|
| Blitch Brandon Wesley | -- | None Listed On Document | |
| Blitch David E | -- | -- | |
| Bell Nancy | -- | -- | |
| Bell Ronald O | -- | -- | |
| Berlin Venix | -- | -- | |
| Edwards William F | -- | -- |
Source: Public Records
Tax History Compared to Growth
Tax History
| Year | Tax Paid | Tax Assessment Tax Assessment Total Assessment is a certain percentage of the fair market value that is determined by local assessors to be the total taxable value of land and additions on the property. | Land | Improvement |
|---|---|---|---|---|
| 2024 | $1,683 | $70,360 | $6,200 | $64,160 |
| 2023 | $1,421 | $60,800 | $6,200 | $54,600 |
| 2022 | $1,279 | $54,920 | $5,000 | $49,920 |
| 2021 | $1,223 | $52,360 | $5,000 | $47,360 |
| 2020 | $1,282 | $54,520 | $5,000 | $49,520 |
| 2019 | $1,282 | $54,520 | $5,000 | $49,520 |
| 2018 | $1,282 | $54,520 | $5,000 | $49,520 |
| 2017 | $1,283 | $54,520 | $5,000 | $49,520 |
| 2016 | $1,285 | $54,520 | $5,000 | $49,520 |
| 2015 | $1,288 | $54,520 | $5,000 | $49,520 |
| 2014 | -- | $54,520 | $5,000 | $49,520 |
| 2013 | -- | $54,520 | $5,000 | $49,520 |
Source: Public Records
Map
Nearby Homes