30510 L Place Ocean Park, WA 98640
Estimated Value: $360,620 - $438,000
3
Beds
2
Baths
1,276
Sq Ft
$315/Sq Ft
Est. Value
About This Home
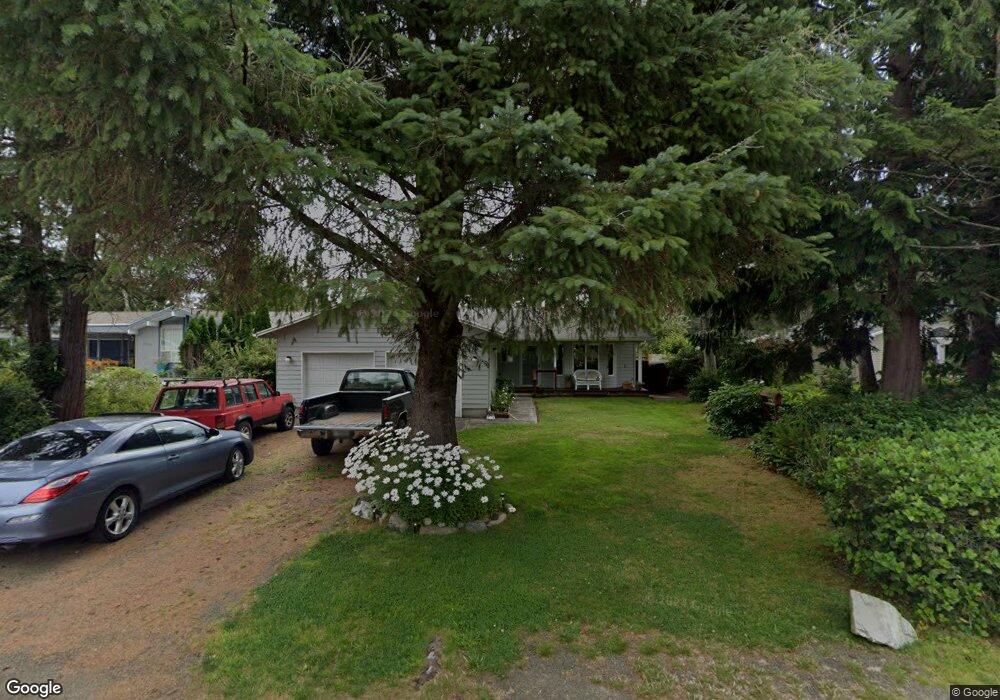
This home is located at 30510 L Place, Ocean Park, WA 98640 and is currently estimated at $401,655, approximately $314 per square foot. 30510 L Place is a home located in Pacific County with nearby schools including Ilwaco Senior High School.
Ownership History
Date
Name
Owned For
Owner Type
Purchase Details
Closed on
May 4, 2016
Sold by
Herrlich Genevieve B and Genevieve B Herrlich Living Tr
Bought by
Woods John R
Current Estimated Value
Purchase Details
Closed on
May 11, 2010
Sold by
Herrlich Genevieve
Bought by
Herrlich Genevieve and The Genevieve B Herrlich Livin
Purchase Details
Closed on
Mar 15, 2007
Sold by
Owen William A and Herrlich Genevieve
Bought by
Herrlich Genevieve
Purchase Details
Closed on
Mar 14, 2007
Sold by
Kaczmarek Howard J and Kaczmarek Karin B
Bought by
Herrlich Genevieve
Purchase Details
Closed on
Mar 12, 2007
Sold by
Owen William A and Herrlich Genevieve
Bought by
Herrlich Genevieve
Create a Home Valuation Report for This Property
The Home Valuation Report is an in-depth analysis detailing your home's value as well as a comparison with similar homes in the area
Home Values in the Area
Average Home Value in this Area
Purchase History
| Date | Buyer | Sale Price | Title Company |
|---|---|---|---|
| Woods John R | -- | None Available | |
| Herrlich Genevieve | -- | None Available | |
| Herrlich Genevieve | -- | None Available | |
| Herrlich Genevieve | -- | First American Title Insu | |
| Herrlich Genevieve | -- | None Available |
Source: Public Records
Tax History Compared to Growth
Tax History
| Year | Tax Paid | Tax Assessment Tax Assessment Total Assessment is a certain percentage of the fair market value that is determined by local assessors to be the total taxable value of land and additions on the property. | Land | Improvement |
|---|---|---|---|---|
| 2025 | $366 | $313,900 | $80,800 | $233,100 |
| 2024 | $366 | $330,400 | $85,000 | $245,400 |
| 2023 | $401 | $310,400 | $50,000 | $260,400 |
| 2022 | $501 | $217,300 | $35,000 | $182,300 |
| 2021 | $533 | $201,900 | $30,000 | $171,900 |
| 2020 | $552 | $186,200 | $30,000 | $156,200 |
| 2019 | $560 | $170,700 | $27,500 | $143,200 |
| 2018 | $579 | $142,800 | $30,000 | $112,800 |
| 2017 | $2,003 | $142,800 | $30,000 | $112,800 |
| 2015 | $1,676 | $128,100 | $30,000 | $98,100 |
| 2014 | -- | $118,300 | $30,000 | $88,300 |
| 2012 | -- | $146,400 | $30,000 | $116,400 |
Source: Public Records
Map
Nearby Homes