A
Seller's Agent in 2024
Aaron Bentle
Cowmen Group
(346) 403-0812
Estimated Value: $258,542 - $280,000
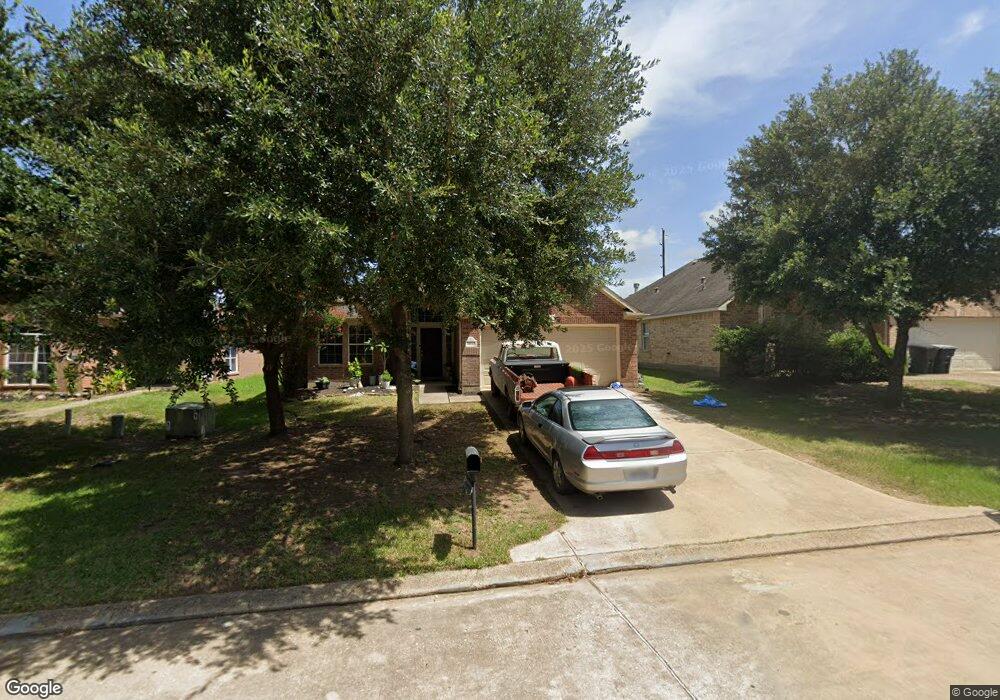
This home is located at 30515 N Sulphur Creek Dr, Magnolia, TX 77355 and is currently estimated at $272,636, approximately $151 per square foot. 30515 N Sulphur Creek Dr is a home located in Montgomery County with nearby schools including Magnolia Elementary School, Magnolia Sixth Grade Campus, and Magnolia Junior High School.
| Date | Buyer | Sale Price | Title Company |
|---|---|---|---|
| Amh 2014-1 Borrower Llc | -- | None Available | |
| Ah4r I Tx Llc | -- | None Available | |
| Ah4r I Tx Dfw Llc | $110,526 | Servicelink | |
| Amh 2014-1 Borrower Llc | -- | -- | |
| Woodard Darryl Scott | -- | Startex 07 Title Company |
| Date | Status | Borrower | Loan Amount |
|---|---|---|---|
| Previous Owner | Woodard Darryl Scott | $156,122 |
| Date | Event | Price | List to Sale | Price per Sq Ft |
|---|---|---|---|---|
| 12/09/2024 12/09/24 | Rented | $1,780 | 0.0% | -- |
| 10/23/2024 10/23/24 | Under Contract | -- | -- | -- |
| 10/14/2024 10/14/24 | Price Changed | $1,780 | -1.9% | $1 / Sq Ft |
| 10/07/2024 10/07/24 | Price Changed | $1,815 | -1.9% | $1 / Sq Ft |
| 09/26/2024 09/26/24 | Price Changed | $1,850 | -0.8% | $1 / Sq Ft |
| 09/19/2024 09/19/24 | Price Changed | $1,865 | -0.8% | $1 / Sq Ft |
| 09/16/2024 09/16/24 | Price Changed | $1,880 | -0.5% | $1 / Sq Ft |
| 09/09/2024 09/09/24 | Price Changed | $1,890 | -0.5% | $1 / Sq Ft |
| 08/29/2024 08/29/24 | For Rent | $1,900 | +12.1% | -- |
| 08/16/2022 08/16/22 | Off Market | $1,695 | -- | -- |
| 08/15/2022 08/15/22 | Rented | $1,695 | 0.0% | -- |
| 08/11/2022 08/11/22 | Under Contract | -- | -- | -- |
| 08/08/2022 08/08/22 | For Rent | $1,695 | +23.3% | -- |
| 12/30/2021 12/30/21 | Off Market | $1,375 | -- | -- |
| 01/28/2019 01/28/19 | Rented | $1,375 | -16.7% | -- |
| 12/29/2018 12/29/18 | Under Contract | -- | -- | -- |
| 09/20/2018 09/20/18 | For Rent | $1,650 | -- | -- |
| Year | Tax Paid | Tax Assessment Tax Assessment Total Assessment is a certain percentage of the fair market value that is determined by local assessors to be the total taxable value of land and additions on the property. | Land | Improvement |
|---|---|---|---|---|
| 2025 | $3,910 | $272,210 | $29,507 | $242,703 |
| 2024 | $4,309 | $247,000 | $29,507 | $217,493 |
| 2023 | $4,309 | $272,950 | $29,510 | $243,440 |
| 2022 | $4,177 | $236,730 | $29,510 | $207,220 |
| 2021 | $3,395 | $182,660 | $29,510 | $153,150 |
| 2020 | $3,437 | $169,830 | $29,510 | $140,320 |
| 2019 | $3,405 | $169,050 | $29,510 | $139,540 |
| 2018 | $3,488 | $165,000 | $24,490 | $140,510 |
| 2017 | $3,567 | $168,200 | $24,490 | $143,710 |
| 2016 | $3,433 | $161,900 | $24,490 | $137,410 |
| 2015 | $3,040 | $152,300 | $24,490 | $127,810 |
| 2014 | $3,040 | $141,740 | $24,490 | $117,250 |
A
Seller's Agent in 2024
Aaron Bentle
Cowmen Group
(346) 403-0812
S
Seller's Agent in 2019
Sarah Matthews
FirstKey Homes
