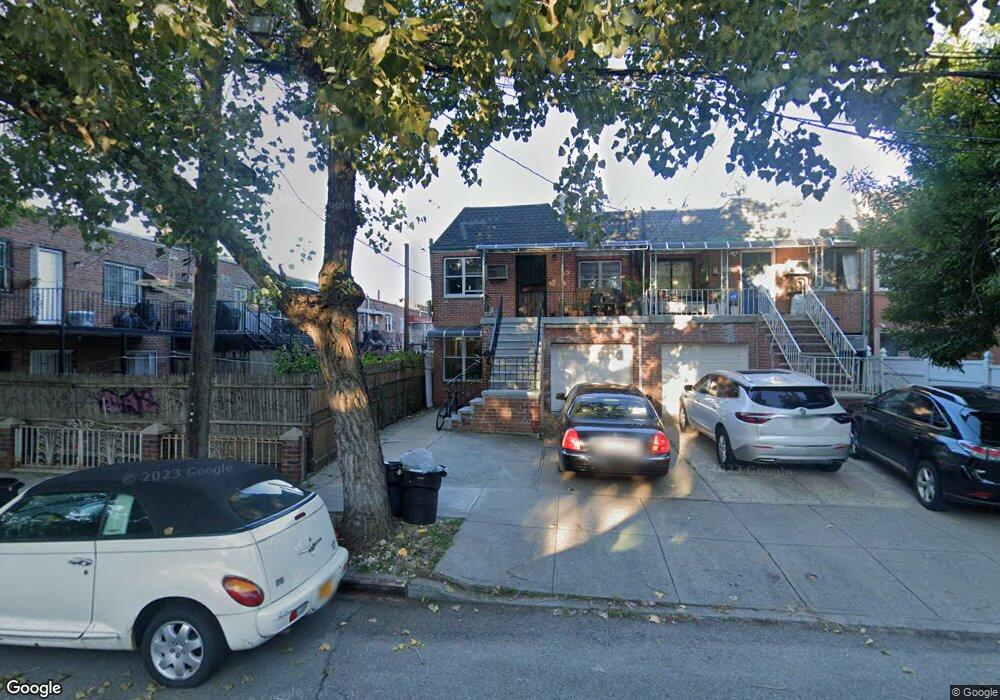
3052 69th St Woodside, NY 11377
Jackson Heights NeighborhoodEstimated Value: $1,036,211 - $1,344,000
Studio
--
Bath
2,520
Sq Ft
$477/Sq Ft
Est. Value
About This Home
This home is located at 3052 69th St, Woodside, NY 11377 and is currently estimated at $1,201,053, approximately $476 per square foot. 3052 69th St is a home located in Queens County with nearby schools including Ps 152 Gwendolyn N Alleyne School, I.S. 010 Horace Greeley, and William Cullen Bryant High School.
Ownership History
Date
Name
Owned For
Owner Type
Purchase Details
Closed on
Nov 2, 2006
Sold by
Japra Gurpal and Singh Dharambir
Bought by
Singh Dharambir
Current Estimated Value
Purchase Details
Closed on
May 19, 2000
Sold by
Pala Pietro
Bought by
Japra Gurpal and Singh Dharambir
Home Financials for this Owner
Home Financials are based on the most recent Mortgage that was taken out on this home.
Original Mortgage
$173,700
Interest Rate
8.14%
Purchase Details
Closed on
Aug 7, 1998
Sold by
Cheung Raymond
Bought by
Pala Pietro
Home Financials for this Owner
Home Financials are based on the most recent Mortgage that was taken out on this home.
Original Mortgage
$202,500
Interest Rate
6.87%
Purchase Details
Closed on
Jun 18, 1997
Sold by
Cheung Raymond and Sze So Ying
Bought by
Cheung Raymond
Create a Home Valuation Report for This Property
The Home Valuation Report is an in-depth analysis detailing your home's value as well as a comparison with similar homes in the area
Home Values in the Area
Average Home Value in this Area
Purchase History
| Date | Buyer | Sale Price | Title Company |
|---|---|---|---|
| Singh Dharambir | $200,000 | -- | |
| Singh Dharambir | $200,000 | -- | |
| Japra Gurpal | $272,000 | -- | |
| Japra Gurpal | $272,000 | -- | |
| Pala Pietro | $225,000 | First American Title Ins Co | |
| Pala Pietro | $225,000 | First American Title Ins Co | |
| Cheung Raymond | -- | First American Title Ins Co | |
| Cheung Raymond | -- | First American Title Ins Co |
Source: Public Records
Mortgage History
| Date | Status | Borrower | Loan Amount |
|---|---|---|---|
| Previous Owner | Japra Gurpal | $173,700 | |
| Previous Owner | Pala Pietro | $202,500 |
Source: Public Records
Tax History
| Year | Tax Paid | Tax Assessment Tax Assessment Total Assessment is a certain percentage of the fair market value that is determined by local assessors to be the total taxable value of land and additions on the property. | Land | Improvement |
|---|---|---|---|---|
| 2025 | $7,996 | $42,200 | $6,890 | $35,310 |
| 2024 | $7,996 | $39,812 | $6,104 | $33,708 |
| 2023 | $7,797 | $38,822 | $5,978 | $32,844 |
| 2022 | $5,484 | $63,900 | $10,560 | $53,340 |
| 2021 | $7,708 | $68,340 | $10,560 | $57,780 |
| 2020 | $7,444 | $64,380 | $10,560 | $53,820 |
| 2019 | $6,940 | $55,140 | $10,560 | $44,580 |
| 2018 | $6,595 | $32,352 | $6,852 | $25,500 |
| 2017 | $6,222 | $30,522 | $6,410 | $24,112 |
| 2016 | $6,102 | $30,522 | $6,410 | $24,112 |
| 2015 | $3,473 | $29,306 | $8,650 | $20,656 |
| 2014 | $3,473 | $27,648 | $9,138 | $18,510 |
Source: Public Records
Map
Nearby Homes
- 69-20 31st Ave
- 3134 68th St
- 30-47 71st St
- 3004 73rd St
- 25-45 72nd St
- 25-37 72nd St
- 32-31 71st St
- 2502 73rd St
- 32-32 60th St
- 51-28 30th Ave Unit 3
- 5525 31st Ave Unit 3L
- 55-23 31st Ave Unit 3H
- 55-23 31st Ave Unit 4G
- 33-25 71st St
- 5110 30th Ave Unit 5K
- 31-28 56th St
- 3045 Hobart St Unit 4H
- 30-47 Hobart St Unit DDB
- 30-47 Hobart St Unit 3M
- 30-47 Hobart St Unit 4K
- 3050 69th St
- 3048 69th St Unit ground floor
- 3048 69th St
- 3048 69th St Unit 1
- 3048 69 Street Woodside Ny 11377 1 Floor
- 6819 31st Ave
- 6821 31st Ave
- 6817 31st Ave
- 3046 69th St
- 6821 31st Ave
- 6821 31st Ave Unit 1st
- 68-21 31st Ave Unit 1
- 68-21 31st Ave Unit 1st
- 68-21 31st Ave
- 6823 31st Ave
- 6815 31st Ave
- 6823 31st Ave Unit 2Fl
- 6823 31st Ave
- 6823 31st Ave Unit 2Fl
- 6811 31st Ave
Your Personal Tour Guide
Ask me questions while you tour the home.