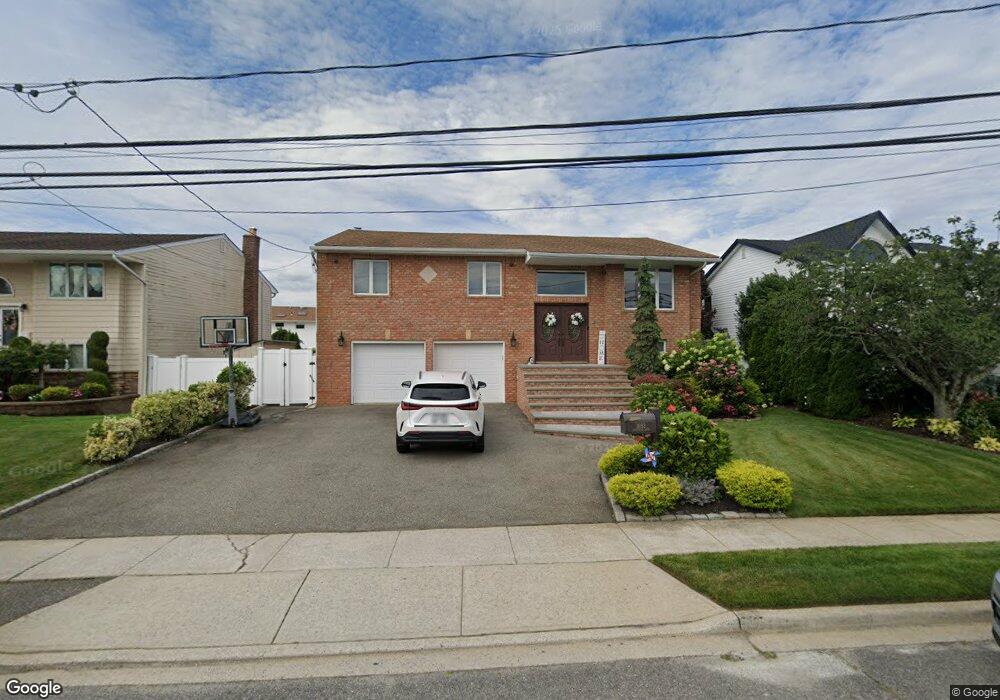
3052 Driftwood Ln Bellmore, NY 11710
Estimated Value: $901,000 - $968,545
4
Beds
3
Baths
1,427
Sq Ft
$655/Sq Ft
Est. Value
About This Home
This home is located at 3052 Driftwood Ln, Bellmore, NY 11710 and is currently estimated at $934,773, approximately $655 per square foot. 3052 Driftwood Ln is a home located in Nassau County with nearby schools including Shore Road School, Winthrop Avenue School, and Grand Avenue Middle School.
Ownership History
Date
Name
Owned For
Owner Type
Purchase Details
Closed on
Aug 26, 2019
Sold by
Raybshteyn Mikhail and Shtilkind Anna
Bought by
Baratto Anna and Baratto Salvatore
Current Estimated Value
Home Financials for this Owner
Home Financials are based on the most recent Mortgage that was taken out on this home.
Original Mortgage
$484,000
Outstanding Balance
$424,812
Interest Rate
3.7%
Mortgage Type
New Conventional
Estimated Equity
$509,961
Purchase Details
Closed on
Aug 1, 2014
Sold by
Formisano Chellie M and Formisano Joseph V
Bought by
Shtilkind Anna and Raybshteyn Mikhail
Home Financials for this Owner
Home Financials are based on the most recent Mortgage that was taken out on this home.
Original Mortgage
$497,250
Interest Rate
4.09%
Mortgage Type
New Conventional
Purchase Details
Closed on
Aug 4, 2005
Sold by
Shapiro Bernice
Bought by
Formisano Joseph
Create a Home Valuation Report for This Property
The Home Valuation Report is an in-depth analysis detailing your home's value as well as a comparison with similar homes in the area
Home Values in the Area
Average Home Value in this Area
Purchase History
| Date | Buyer | Sale Price | Title Company |
|---|---|---|---|
| Baratto Anna | $630,000 | None Available | |
| Shtilkind Anna | $585,000 | -- | |
| Shtilkind Anna | $585,000 | -- | |
| Formisano Joseph | $590,000 | -- |
Source: Public Records
Mortgage History
| Date | Status | Borrower | Loan Amount |
|---|---|---|---|
| Open | Baratto Anna | $484,000 | |
| Previous Owner | Shtilkind Anna | $497,250 |
Source: Public Records
Tax History Compared to Growth
Tax History
| Year | Tax Paid | Tax Assessment Tax Assessment Total Assessment is a certain percentage of the fair market value that is determined by local assessors to be the total taxable value of land and additions on the property. | Land | Improvement |
|---|---|---|---|---|
| 2025 | $18,527 | $625 | $249 | $376 |
| 2024 | $4,557 | $608 | $242 | $366 |
| 2023 | $18,434 | $608 | $249 | $359 |
| 2022 | $18,434 | $608 | $249 | $359 |
| 2021 | $26,417 | $583 | $239 | $344 |
| 2020 | $19,619 | $1,086 | $709 | $377 |
| 2019 | $5,157 | $1,086 | $709 | $377 |
| 2018 | $12,157 | $1,086 | $0 | $0 |
| 2017 | $8,779 | $931 | $709 | $222 |
| 2016 | $12,856 | $931 | $709 | $222 |
| 2015 | -- | $931 | $709 | $222 |
| 2014 | -- | $931 | $709 | $222 |
| 2013 | $3,565 | $931 | $709 | $222 |
Source: Public Records
Map
Nearby Homes
- 3142 Shore Rd
- 2468 Riviera Ln
- 3058 Susan Rd
- 3048 Timothy Rd
- 2092 Vine Dr
- 3066 Ira Rd
- 2858 Shore Rd
- 2694 Dorothy St
- 2074 Ellen Dr
- 2911 Bellmore Ave
- 3370 Jason Ct
- 2462 Marine Place
- 3012 Mandalay Beach Rd
- 2035 Sans Ave
- 2956 Judith Dr
- 2495 Navy Place
- 2925 Hewlett Ave
- 2466 Army Place
- 2794 Judith Dr
- 14 Island Plaza
- 3052 Driftwood Ln
- 3058 Driftwood Ln
- 3044 Driftwood Ln
- 2470 Malibu Rd
- 3064 Driftwood Ln
- 3073 Shore Rd
- 3053 Driftwood Ln
- 3045 Driftwood Ln
- 3077 Shore Rd
- 3059 Driftwood Ln
- 3070 Driftwood Ln
- 3059 Shore Rd
- 3065 Driftwood Ln
- 2460 Malibu Rd
- 2471 Malibu Rd
- 2479 Malibu Rd
- 3083 Shore Rd
- 3071 Driftwood Ln
- 2498 Malibu Rd
- 2485 Malibu Rd