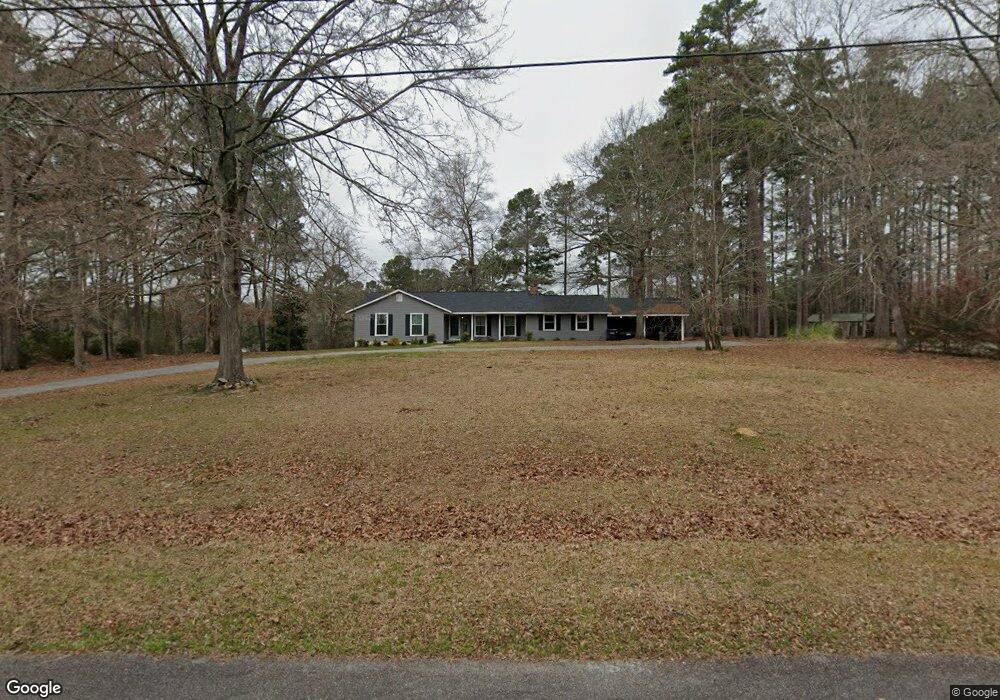
3052 Twin Pine Rd Thomson, GA 30824
Estimated Value: $301,000 - $377,000
3
Beds
2
Baths
2,225
Sq Ft
$147/Sq Ft
Est. Value
About This Home
This home is located at 3052 Twin Pine Rd, Thomson, GA 30824 and is currently estimated at $326,584, approximately $146 per square foot. 3052 Twin Pine Rd is a home located in McDuffie County with nearby schools including Thomson High School and Southern Bible Christian Acade.
Ownership History
Date
Name
Owned For
Owner Type
Purchase Details
Closed on
Dec 31, 2007
Sold by
Chalker Brad
Bought by
Roberts David
Current Estimated Value
Home Financials for this Owner
Home Financials are based on the most recent Mortgage that was taken out on this home.
Original Mortgage
$226,500
Outstanding Balance
$140,194
Interest Rate
6.05%
Mortgage Type
New Conventional
Estimated Equity
$186,390
Purchase Details
Closed on
Oct 8, 2004
Sold by
Chalker Bradley Guy
Bought by
Chalker Bradley Guy
Purchase Details
Closed on
Feb 21, 2003
Sold by
Chalker Bradley Guy
Bought by
Chalker Bradley Guy
Purchase Details
Closed on
May 26, 2000
Sold by
Chalker Jeanna B
Bought by
Chalker Bradley Guy
Purchase Details
Closed on
Mar 18, 1999
Sold by
Chalker C Steve
Bought by
Chalker Jeanna B
Purchase Details
Closed on
Feb 27, 1998
Sold by
Burton William F
Bought by
Chalker C Steve
Purchase Details
Closed on
Jun 29, 1989
Bought by
Burton William F
Create a Home Valuation Report for This Property
The Home Valuation Report is an in-depth analysis detailing your home's value as well as a comparison with similar homes in the area
Home Values in the Area
Average Home Value in this Area
Purchase History
| Date | Buyer | Sale Price | Title Company |
|---|---|---|---|
| Roberts David | $226,500 | -- | |
| Chalker Bradley Guy | -- | -- | |
| Chalker Bradley Guy | -- | -- | |
| Chalker Bradley Guy | $117,000 | -- | |
| Chalker Jeanna B | -- | -- | |
| Chalker C Steve | $114,000 | -- | |
| Burton William F | $97,400 | -- |
Source: Public Records
Mortgage History
| Date | Status | Borrower | Loan Amount |
|---|---|---|---|
| Open | Roberts David | $226,500 |
Source: Public Records
Tax History
| Year | Tax Paid | Tax Assessment Tax Assessment Total Assessment is a certain percentage of the fair market value that is determined by local assessors to be the total taxable value of land and additions on the property. | Land | Improvement |
|---|---|---|---|---|
| 2025 | $3,043 | $122,520 | $13,534 | $108,986 |
| 2024 | $3,043 | $116,606 | $13,140 | $103,466 |
| 2023 | $2,928 | $110,814 | $11,680 | $99,134 |
| 2022 | $2,378 | $85,011 | $10,220 | $74,791 |
| 2021 | $1,935 | $67,217 | $8,760 | $58,457 |
| 2020 | $1,796 | $61,121 | $8,400 | $52,721 |
| 2019 | $1,803 | $61,121 | $8,400 | $52,721 |
| 2018 | $1,804 | $61,121 | $8,400 | $52,721 |
| 2017 | $1,370 | $47,547 | $8,400 | $39,147 |
| 2016 | $1,413 | $48,632 | $8,400 | $40,232 |
| 2015 | $1,274 | $48,632 | $8,400 | $40,232 |
| 2014 | $1,941 | $75,090 | $8,400 | $66,690 |
| 2013 | -- | $75,090 | $8,400 | $66,690 |
Source: Public Records
Map
Nearby Homes
- 3021 Fairway Dr
- 3159 Twin Pine Rd
- 2760 Deer Trail Rd
- 293 S Lake Dr
- 3287 Surrey Rd
- 1684 Stagecoach Rd
- 10544 Georgia 17
- 2 Georgia 17
- 1 Georgia 17
- 319 Bordeaux Dr
- 329 Bordeaux Dr
- 357 Bordeaux Dr
- 359 Bordeaux Dr
- 353 Bordeaux Dr
- 355 Bordeaux Dr
- 351 Bordeaux Dr
- 314 Bordeaux Dr
- 354 Bordeaux Dr
- 358 Bordeaux Dr
- 356 Bordeaux Dr
- 3036 Twin Pine Rd
- 3076 Twin Pine Rd
- 3026 Twin Pine Rd
- LOT #86 Twin Pine Rd
- 00 Twin Pine Rd
- 3025 Twin Pine Rd
- 3016 Twin Pine Rd
- 3022 Fairway Dr
- 3514 Surrey Rd
- 3002 Twin Pine Rd
- 3023 Fairway Dr
- 3542 Surrey Rd
- 3588 Surrey Rd
- 2883 Deer Trail Rd
- 2935 Fawn Run Rd
- 2923 Fawn Run Rd
- 3146 Twin Pine Rd
- 630 Stagecoach Rd NE
- 2983 Twin Pine Rd
- 3572 Surrey Rd
Your Personal Tour Guide
Ask me questions while you tour the home.