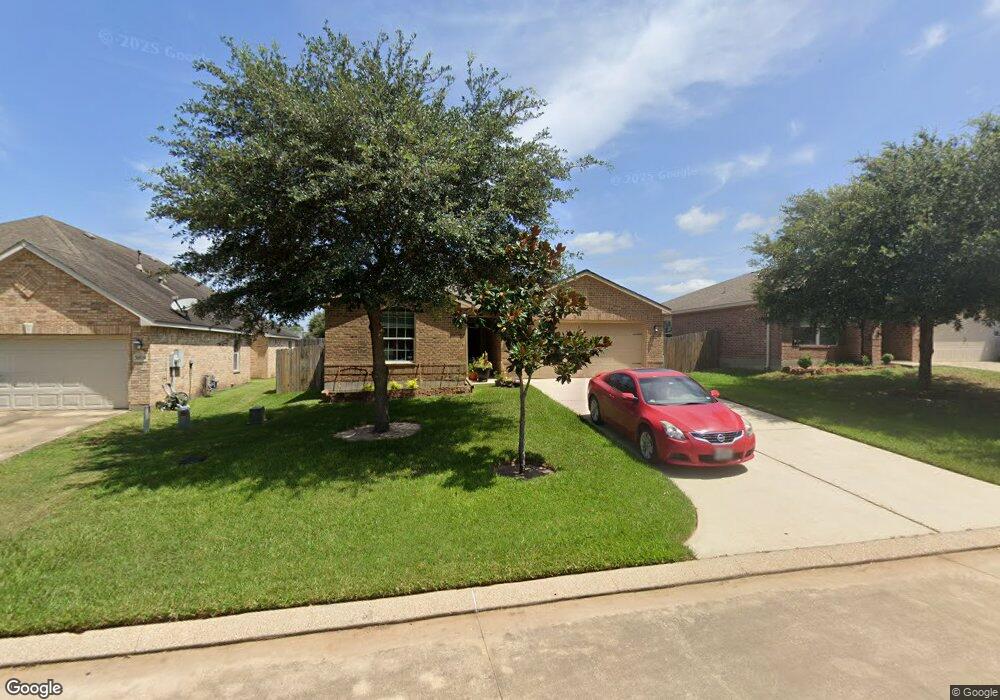
30523 N Sulphur Creek Dr Magnolia, TX 77355
Estimated Value: $246,583 - $334,000
--
Bed
--
Bath
1,657
Sq Ft
$177/Sq Ft
Est. Value
About This Home
This home is located at 30523 N Sulphur Creek Dr, Magnolia, TX 77355 and is currently estimated at $293,396, approximately $177 per square foot. 30523 N Sulphur Creek Dr is a home with nearby schools including Magnolia Elementary School, Magnolia Sixth Grade Campus, and Magnolia Junior High School.
Ownership History
Date
Name
Owned For
Owner Type
Purchase Details
Closed on
Oct 21, 2021
Sold by
Girard Herbert G and Girard Angela G
Bought by
Hatcher Ashley Marie
Current Estimated Value
Home Financials for this Owner
Home Financials are based on the most recent Mortgage that was taken out on this home.
Original Mortgage
$184,300
Outstanding Balance
$168,064
Interest Rate
2.8%
Mortgage Type
New Conventional
Estimated Equity
$125,332
Purchase Details
Closed on
Jun 21, 2013
Sold by
Lgi Homes Lakes Of Magnolia Llc
Bought by
Girard Herbert G
Home Financials for this Owner
Home Financials are based on the most recent Mortgage that was taken out on this home.
Original Mortgage
$156,020
Interest Rate
3.54%
Mortgage Type
New Conventional
Purchase Details
Closed on
Oct 12, 2012
Sold by
Lgi Homes Group Llc
Bought by
Girard Herbert G
Purchase Details
Closed on
Jul 16, 2012
Sold by
Dci Of Magnolia Inc
Bought by
Girard Herbert G
Create a Home Valuation Report for This Property
The Home Valuation Report is an in-depth analysis detailing your home's value as well as a comparison with similar homes in the area
Home Values in the Area
Average Home Value in this Area
Purchase History
| Date | Buyer | Sale Price | Title Company |
|---|---|---|---|
| Hatcher Ashley Marie | -- | None Available | |
| Girard Herbert G | -- | Texas American Title Company | |
| Girard Herbert G | -- | -- | |
| Girard Herbert G | -- | -- |
Source: Public Records
Mortgage History
| Date | Status | Borrower | Loan Amount |
|---|---|---|---|
| Open | Hatcher Ashley Marie | $184,300 | |
| Previous Owner | Girard Herbert G | $156,020 |
Source: Public Records
Tax History Compared to Growth
Tax History
| Year | Tax Paid | Tax Assessment Tax Assessment Total Assessment is a certain percentage of the fair market value that is determined by local assessors to be the total taxable value of land and additions on the property. | Land | Improvement |
|---|---|---|---|---|
| 2025 | $2,563 | $260,269 | -- | -- |
| 2024 | $2,689 | $236,608 | $29,464 | $207,144 |
| 2023 | $2,689 | $245,760 | $29,460 | $227,860 |
| 2022 | $3,942 | $223,420 | $29,460 | $193,960 |
| 2021 | $3,262 | $175,480 | $29,460 | $146,020 |
| 2020 | $3,319 | $164,030 | $29,460 | $134,570 |
| 2019 | $3,298 | $163,760 | $29,460 | $134,300 |
| 2018 | $2,839 | $158,790 | $24,490 | $134,300 |
| 2017 | $3,426 | $161,550 | $24,490 | $137,060 |
| 2016 | $3,154 | $148,760 | $24,490 | $132,320 |
| 2015 | $2,687 | $135,240 | $15,920 | $119,320 |
| 2014 | $2,687 | $135,240 | $15,920 | $119,320 |
Source: Public Records
Map
Nearby Homes
- 30607 N Sulphur Creek Dr
- 38214 E Sulphur Creek Dr
- 30515 Red Bluff Cir
- 31011 E Lost Creek Blvd
- 31015 E Lost Creek Blvd
- 38910 Fm 1774 Rd
- 28812 Village Bend
- 28822 Village Bend
- 18523 Burch Creek Ln
- 30812 Willow Green Ln
- 29232 Sky Forest
- 30367 Limber Pines Dr
- 100 Sterling River Ln
- 28433 Wild Oaks
- 30731 N Cripple Creek Dr
- 29122 Champions Dr
- 135 Sterling River Ln
- 28713 Wood Song Trail
- 30814 N Cripple Creek Dr
- 18666 Legend Oaks Dr
- 30527 N Sulphur Creek Dr
- 30519 N Sulphur Creek Dr
- 30531 N Sulphur Creek Dr
- 30515 N Sulphur Creek Dr
- 30511 N Sulphur Creek Dr
- 30535 N Sulphur Creek Dr
- 30526 N Sulphur Creek Dr
- 30514 N Sulphur Creek Dr
- 30518 N Sulphur Creek Dr
- 30510 N Sulphur Creek Dr
- 30530 N Sulphur Creek Dr
- 30603 N Sulphur Creek Dr
- 30534 N Sulphur Creek Dr
- 30507 N Sulphur Creek Dr
- 30602 N Sulphur Creek Dr
- 30515 S Sulphur Creek Dr
- 30519 S Sulphur Creek Dr
- 30523 S Sulphur Creek Dr
- 30606 N Sulphur Creek Dr
- 30507 S Sulphur Creek Dr