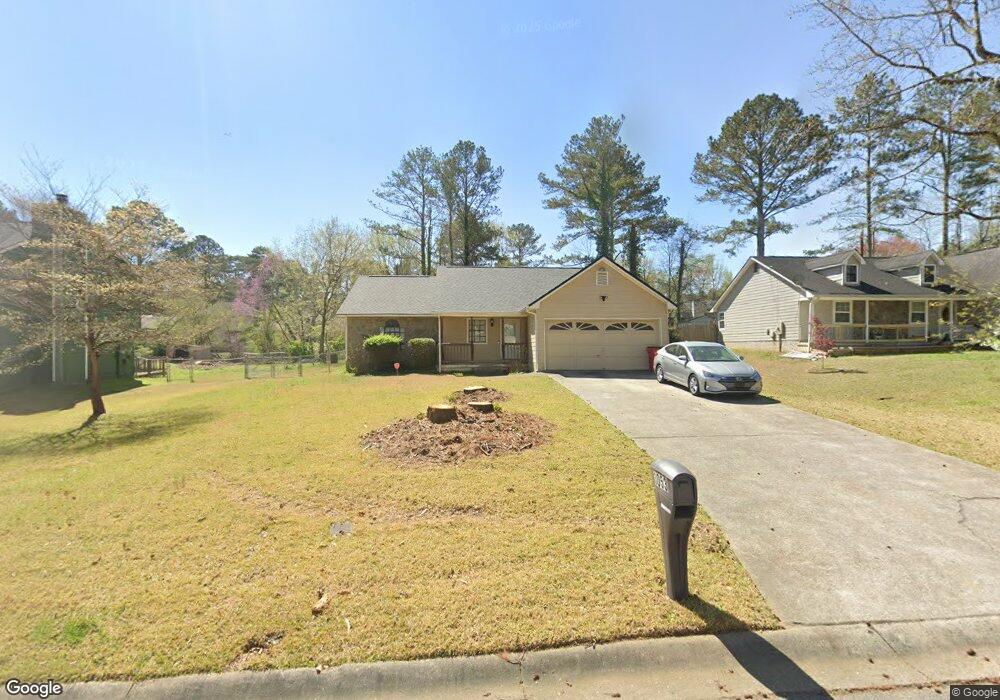
3053 Carriage Trail Jonesboro, GA 30236
Estimated Value: $226,000 - $272,000
3
Beds
2
Baths
1,396
Sq Ft
$180/Sq Ft
Est. Value
About This Home
This home is located at 3053 Carriage Trail, Jonesboro, GA 30236 and is currently estimated at $251,362, approximately $180 per square foot. 3053 Carriage Trail is a home located in Clayton County with nearby schools including Mt. Zion Primary School, Mount Zion Elementary School, and Rex Mill Middle School.
Ownership History
Date
Name
Owned For
Owner Type
Purchase Details
Closed on
Aug 31, 2018
Sold by
Davis Robert J
Bought by
Chaney Anthony Dwight
Current Estimated Value
Home Financials for this Owner
Home Financials are based on the most recent Mortgage that was taken out on this home.
Original Mortgage
$137,464
Outstanding Balance
$120,571
Interest Rate
4.87%
Mortgage Type
FHA
Estimated Equity
$130,791
Purchase Details
Closed on
Feb 6, 2009
Sold by
Encore Credit R Trust 2005-2
Bought by
Davis Robert J
Purchase Details
Closed on
Jul 1, 2008
Sold by
Daniels Michael R and Daniels Inga E
Bought by
Encore Credit Receiv Trust 200
Purchase Details
Closed on
May 7, 1998
Sold by
Fisher Edgar H
Bought by
Daniels Inga E
Home Financials for this Owner
Home Financials are based on the most recent Mortgage that was taken out on this home.
Original Mortgage
$83,536
Interest Rate
7.11%
Mortgage Type
FHA
Create a Home Valuation Report for This Property
The Home Valuation Report is an in-depth analysis detailing your home's value as well as a comparison with similar homes in the area
Home Values in the Area
Average Home Value in this Area
Purchase History
| Date | Buyer | Sale Price | Title Company |
|---|---|---|---|
| Chaney Anthony Dwight | $140,000 | -- | |
| Davis Robert J | $28,000 | -- | |
| Encore Credit Receiv Trust 200 | $83,732 | -- | |
| Daniels Inga E | $84,500 | -- |
Source: Public Records
Mortgage History
| Date | Status | Borrower | Loan Amount |
|---|---|---|---|
| Open | Chaney Anthony Dwight | $137,464 | |
| Previous Owner | Daniels Inga E | $83,536 |
Source: Public Records
Tax History Compared to Growth
Tax History
| Year | Tax Paid | Tax Assessment Tax Assessment Total Assessment is a certain percentage of the fair market value that is determined by local assessors to be the total taxable value of land and additions on the property. | Land | Improvement |
|---|---|---|---|---|
| 2024 | $3,534 | $100,600 | $8,000 | $92,600 |
| 2023 | $3,330 | $92,240 | $8,000 | $84,240 |
| 2022 | $2,754 | $80,160 | $8,000 | $72,160 |
| 2021 | $1,920 | $58,600 | $8,000 | $50,600 |
| 2020 | $1,711 | $52,776 | $8,000 | $44,776 |
| 2019 | $1,611 | $49,684 | $6,400 | $43,284 |
| 2018 | $1,095 | $36,984 | $6,400 | $30,584 |
| 2017 | $832 | $30,438 | $6,400 | $24,038 |
| 2016 | $718 | $27,639 | $6,400 | $21,239 |
| 2015 | $669 | $0 | $0 | $0 |
| 2014 | $586 | $24,706 | $7,200 | $17,506 |
Source: Public Records
Map
Nearby Homes
- 3087 Drexel Ln
- 7074 Babbling Brook Dr
- 7101 Hazelwood Dr Unit 8
- 3140 Glen Hollow Dr
- 3145 Deerfield Way
- 2959 Drexel Ln
- 6968 Fielder Rd
- 3189 Glen Hollow Dr
- 7161 Laurel Creek Dr
- 6921 Babbling Brook Dr
- 2973 Botany Dr
- 2968 Preston Dr
- 3193 Medina Dr
- 2877 Kensington Way
- 7274 Mountain Laurel Way
- 3168 Rock Creek Dr
- 3085 Ashbury Ln Unit 8
- 3353 Medina Dr
- 3401 Mosswood Ln
- 3045 Carriage Trail
- 3063 Carriage Trail Unit 6
- 0 Carriage Trail Unit 3262329
- 0 Carriage Trail Unit 7293413
- 0 Carriage Trail Unit 3160271
- 0 Carriage Trail Unit 8428165
- 0 Carriage Trail Unit 8348154
- 0 Carriage Trail Unit 8293267
- 0 Carriage Trail Unit 8138007
- 3071 Carriage Trail
- 3039 Carriage Trail Unit 6
- 3056 Drexel Ln
- 3062 Drexel Ln
- 3048 Drexel Ln
- 3070 Drexel Ln
- 3054 Carriage Trail
- 3046 Carriage Trail
- 3062 Carriage Trail Unit 6
- 3079 Carriage Trail
- 3040 Drexel Ln