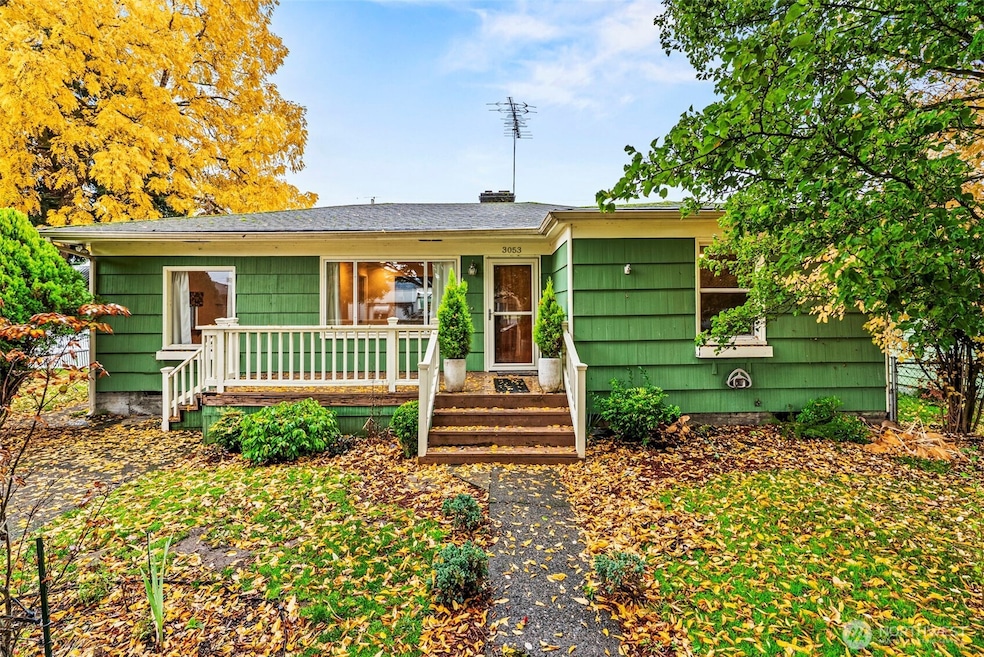
3053 Fir St Longview, WA 98632
Olympic West NeighborhoodEstimated payment $2,085/month
Highlights
- No HOA
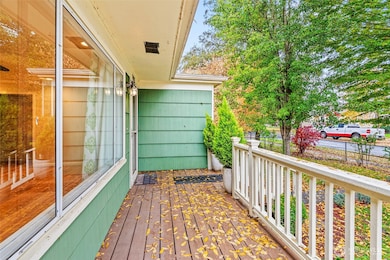
- Patio
- 1-Story Property
- 2 Car Detached Garage
- Bathroom on Main Level
- Garden
About This Home
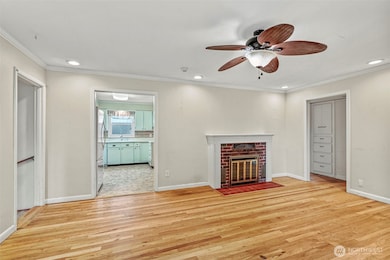
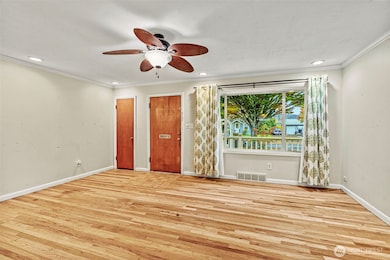
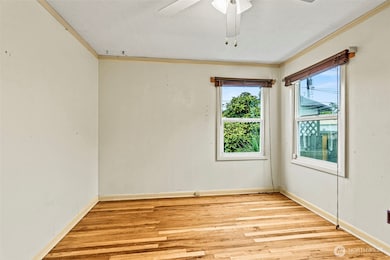
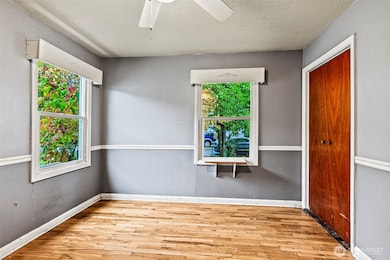
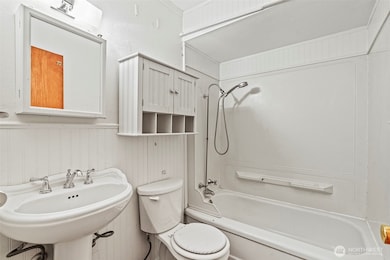
Welcome to this charming 3-bedroom, 2-bath home! This property offers both comfort and functionality, featuring a versatile layout and a cozy fireplace in the living room. The detached garage provides extra storage or workshop space, while the convenient utility room adds everyday practicality. Step outside to enjoy the large garden area , perfect for growing your own vegetables or flowers, and relax under the gazebo on the raised patio, ideal for entertaining or quiet evenings outdoors. A wonderful opportunity to own a well-kept home with a great outdoor living space in a convenient Longview location.

Source: Northwest Multiple Listing Service (NWMLS)
MLS#: 2451292
Home Details
Home Type
- Single Family
Est. Annual Taxes
- $2,572
Year Built
- Built in 1951
Lot Details
- 5,998 Sq Ft Lot
- Property is Fully Fenced
- Level Lot
- Garden
Parking
- 2 Car Detached Garage
Home Design
- Poured Concrete
- Composition Roof
- Wood Composite
Interior Spaces
- 1,239 Sq Ft Home
- 1-Story Property
- Wood Burning Fireplace
- Dining Room
- Carpet
Kitchen
- Stove
- Microwave
- Dishwasher
- Disposal
Bedrooms and Bathrooms
- 3 Main Level Bedrooms
- Bathroom on Main Level
Outdoor Features
- Patio
Utilities
- Window Unit Cooling System
- Heating System Mounted To A Wall or Window
Community Details
- No Home Owners Association
- Olympic Subdivision
Listing and Financial Details
- Down Payment Assistance Available
- Visit Down Payment Resource Website
- Legal Lot and Block 37 / 49
- Assessor Parcel Number 06179
Map
Home Values in the Area
Average Home Value in this Area
Tax History
| Year | Tax Paid | Tax Assessment Tax Assessment Total Assessment is a certain percentage of the fair market value that is determined by local assessors to be the total taxable value of land and additions on the property. | Land | Improvement |
|---|---|---|---|---|
| 2024 | $2,748 | $316,970 | $39,970 | $277,000 |
| 2023 | $2,657 | $307,020 | $39,970 | $267,050 |
| 2022 | $2,477 | $299,250 | $39,970 | $259,280 |
| 2021 | $2,464 | $248,850 | $38,060 | $210,790 |
| 2020 | $1,947 | $222,970 | $38,060 | $184,910 |
| 2019 | $1,776 | $184,814 | $38,063 | $146,751 |
| 2018 | $1,641 | $164,570 | $38,060 | $126,510 |
| 2017 | $1,418 | $124,840 | $36,230 | $88,610 |
| 2016 | $1,369 | $109,830 | $34,510 | $75,320 |
| 2015 | $1,477 | $108,460 | $34,510 | $73,950 |
| 2013 | -- | $104,580 | $33,500 | $71,080 |
Property History
| Date | Event | Price | List to Sale | Price per Sq Ft |
|---|---|---|---|---|
| 11/05/2025 11/05/25 | For Sale | $355,000 | -- | $287 / Sq Ft |
Purchase History
| Date | Type | Sale Price | Title Company |
|---|---|---|---|
| Interfamily Deed Transfer | -- | None Available |
Source: Northwest Multiple Listing Service (NWMLS)
MLS Number: 2451292
APN: 0-6179
Disclaimer: Certain information contained herein is derived from information provided by parties other than Homes.com. All information provided is deemed reliable, but is not guaranteed to be accurate and should be independently verified.
![]() All data is obtained from various sources and may not have been verified by broker or MLS GRID. Supplied Open House Information is subject to change without notice. All information should be independently reviewed and verified for accuracy. Properties may or may not be listed by the office/agent presenting the information. Listing information is provided by the Northwest Multiple Listing Service (NWMLS). Property information is based on available data that may include MLS information, county records, and other sources. Listings marked with the 3 tree icon and provided by NWMLS. All properties are subject to prior sale or withdrawal. IDX information is provided exclusively for consumers’ personal noncommercial use, that it may not be used for any purpose other than to identify prospective properties consumers may be interested in purchasing, that the data is deemed reliable but is not guaranteed by MLS GRID. ©2025 NWMLS.
All data is obtained from various sources and may not have been verified by broker or MLS GRID. Supplied Open House Information is subject to change without notice. All information should be independently reviewed and verified for accuracy. Properties may or may not be listed by the office/agent presenting the information. Listing information is provided by the Northwest Multiple Listing Service (NWMLS). Property information is based on available data that may include MLS information, county records, and other sources. Listings marked with the 3 tree icon and provided by NWMLS. All properties are subject to prior sale or withdrawal. IDX information is provided exclusively for consumers’ personal noncommercial use, that it may not be used for any purpose other than to identify prospective properties consumers may be interested in purchasing, that the data is deemed reliable but is not guaranteed by MLS GRID. ©2025 NWMLS.
Based on information submitted to the MLS GRID
- 3019 Fir St
- 3015 Dover St
- 3153 Florida St
- 767 32nd Ave
- 2938 Washington Way
- 2925 Dover St
- 3128 Garfield St
- 2951 Douglas St
- 2848 Dover St
- 1109 32nd Ave
- 805 33rd Ave
- 256 Douglas St
- 2902 Garfield St
- 358 Cypress St
- 282 Colorado St
- 767 34th Ave
- 278 Colorado St
- 311 Baltimore St
- 307 Baltimore St
- 2727 Hemlock St