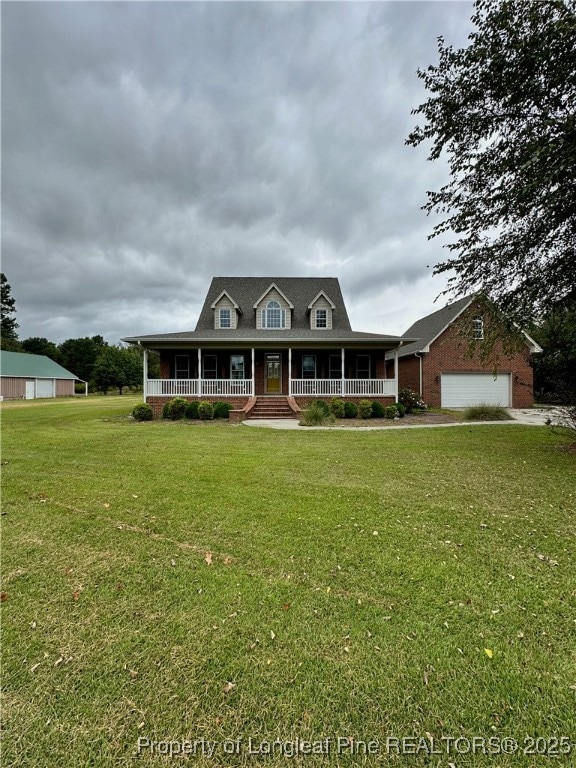


3054 Burney Rd Bladenboro, NC 28320
Estimated payment $2,197/month
Highlights
- Barn
- Indoor Pool
- Wood Flooring
- Stables
- Deck
- Main Floor Primary Bedroom
About This Home
Property owned by US Department of HUD, Case # 387-597497, listed "IE" subject to buyers appraisal, seller makes no representations or warranties as to property condition, HUD homes are sold "As-Is", pre-1978 must include LBP notice, EHO, seller may contribute up to 2.5% for buyers closing costs upon request. Information and Disclosures can be found at www.hudhomestore.com, bids submitted by HUD registered agents/agencies only, de-Winterization and re-Winterization for inspections at buyers expense, property inquiries
Home Details
Home Type
- Single Family
Year Built
- Built in 2000
Lot Details
- 1.7 Acre Lot
- Lot Dimensions are 262 x 270
- Privacy Fence
- Fenced
- Level Lot
- Cleared Lot
- Zoning described as RA-20M - Residential/Agricultural
Parking
- 4 Car Attached Garage
- 1 Carport Space
- Garage Door Opener
Home Design
- Brick Veneer
- Wood Frame Construction
- Frame Construction
Interior Spaces
- 2,502 Sq Ft Home
- 1.5-Story Property
- 2 Fireplaces
- Gas Fireplace
- Blinds
- Crawl Space
- Laundry on main level
Kitchen
- Eat-In Kitchen
- Kitchen Island
Flooring
- Wood
- Parquet
- Tile
Bedrooms and Bathrooms
- 3 Bedrooms
- Primary Bedroom on Main
- Walk-In Closet
- In-Law or Guest Suite
- Double Vanity
- Bathtub with Shower
- Walk-in Shower
Pool
- Indoor Pool
- In Ground Pool
- Saltwater Pool
Outdoor Features
- Deck
- Covered Patio or Porch
- Outdoor Storage
Schools
- Bladen County Schools Middle School
- Bladen County Schools High School
Utilities
- Heating System Uses Gas
- Power Generator
- Septic Tank
Additional Features
- Barn
- Stables
Community Details
- No Home Owners Association
Listing and Financial Details
- Assessor Parcel Number 0040948
- Seller Considering Concessions
Map
Home Values in the Area
Average Home Value in this Area
Tax History
| Year | Tax Paid | Tax Assessment Tax Assessment Total Assessment is a certain percentage of the fair market value that is determined by local assessors to be the total taxable value of land and additions on the property. | Land | Improvement |
|---|---|---|---|---|
| 2025 | $2,261 | $262,920 | $8,330 | $254,590 |
| 2024 | $2,261 | $262,920 | $8,330 | $254,590 |
| 2023 | $2,322 | $262,920 | $8,330 | $254,590 |
| 2022 | $2,195 | $262,920 | $8,330 | $254,590 |
| 2021 | $2,200 | $252,870 | $8,330 | $244,540 |
| 2020 | $2,200 | $252,870 | $8,330 | $244,540 |
| 2019 | $2,200 | $252,870 | $8,330 | $244,540 |
| 2018 | $2,200 | $252,870 | $8,330 | $244,540 |
| 2017 | $2,200 | $252,870 | $8,330 | $244,540 |
| 2015 | $1,906 | $252,870 | $8,330 | $244,540 |
| 2014 | $2,250 | $241,260 | $7,710 | $233,550 |
| 2013 | -- | $268,380 | $10,840 | $257,540 |
Property History
| Date | Event | Price | List to Sale | Price per Sq Ft |
|---|---|---|---|---|
| 12/18/2025 12/18/25 | Price Changed | $382,300 | -10.0% | $153 / Sq Ft |
| 11/19/2025 11/19/25 | Price Changed | $424,800 | -10.0% | $170 / Sq Ft |
| 10/02/2025 10/02/25 | For Sale | $472,000 | -- | $189 / Sq Ft |
Purchase History
| Date | Type | Sale Price | Title Company |
|---|---|---|---|
| Special Warranty Deed | -- | None Listed On Document | |
| Special Warranty Deed | -- | None Listed On Document | |
| Trustee Deed | $428,400 | None Listed On Document | |
| Trustee Deed | $428,400 | None Listed On Document | |
| Warranty Deed | $435,000 | -- |
Mortgage History
| Date | Status | Loan Amount | Loan Type |
|---|---|---|---|
| Previous Owner | $427,121 | FHA |
Source: Longleaf Pine REALTORS®
MLS Number: 751266
APN: 027800970340
Disclaimer: Certain information contained herein is derived from information provided by parties other than Homes.com. All information provided is deemed reliable, but is not guaranteed to be accurate and should be independently verified.
![]() IDX information is provided exclusively for personal, non-commercial use, and may not be used for any purpose other than to identify prospective properties consumers may be interested in purchasing.
IDX information is provided exclusively for personal, non-commercial use, and may not be used for any purpose other than to identify prospective properties consumers may be interested in purchasing.
Information is deemed reliable but not guaranteed.
- .. Nc 242 Hwy S
- 410 Elizabethtown Rd
- 202 Lewis St
- 0 E Poplar St E Unit 25818956
- 214 E Bladen St
- 273 E Poplar St
- 425 S Main St
- 0 Britt St Unit 100535132
- 3458 N Mitchell Ford Rd
- 510 Village St
- 0 N Carolina 242 Hwy S Unit 753742
- 274 Lawrence Brown Rd
- 64 Outfield Dr
- 0 Ja Carroll Rd Unit 100537199
- 10140 N College St
- 193 Peach St
- 91 N Elmhurst St
- 80 N Elmhurst St
- 153 Hillside St
- 152 Hillside St
- 200 Scrimon St
- 13388 Nc Highway 72 E
- 57 Celia Dr
- 45 Celia Dr
- 56 Celia Dr
- 25 Celia Dr
- 429 Milan Ave
- 472 Milan Ave
- 657 Wildwood Rd
- 790 Old Whiteville Rd
- 2411 Oak St
- 208 E Columbus St
- 106 W 6th Ave
- 220 W 3rd Ave
- 3601 Hillcrest Dr Unit B
- 105 Medley Ln
- 616 Amberdale Cir W
- 616 Amberdale West Cir
- 907 Caldwell St Unit A
- 209 1/2 W 16th St
