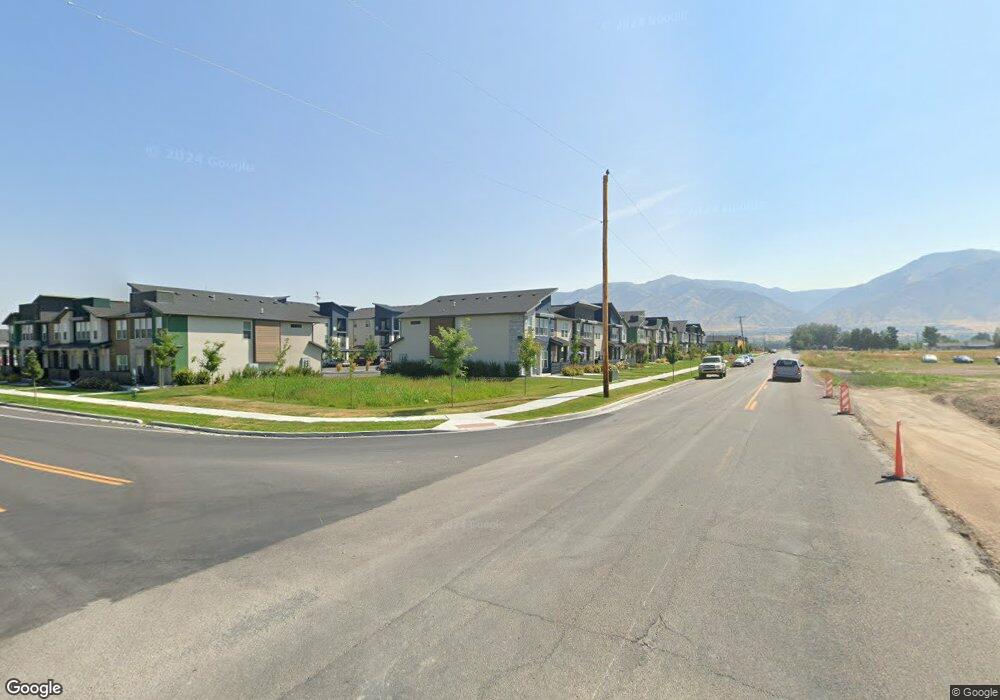
3054 S 1000 W Unit 82 Nibley, UT 84321
Estimated Value: $403,000 - $529,000
--
Bed
--
Bath
1,093
Sq Ft
$408/Sq Ft
Est. Value
About This Home
This home is located at 3054 S 1000 W Unit 82, Nibley, UT 84321 and is currently estimated at $446,241, approximately $408 per square foot. 3054 S 1000 W Unit 82 is a home located in Cache County with nearby schools including Heritage School, South Cache Middle School, and Spring Creek Middle School.
Ownership History
Date
Name
Owned For
Owner Type
Purchase Details
Closed on
Nov 8, 2012
Sold by
Black Cody J and Black Dawn D
Bought by
Maughan Jordan and Bolen Britnee
Current Estimated Value
Home Financials for this Owner
Home Financials are based on the most recent Mortgage that was taken out on this home.
Original Mortgage
$175,510
Outstanding Balance
$120,615
Interest Rate
3.35%
Mortgage Type
New Conventional
Estimated Equity
$325,626
Purchase Details
Closed on
Feb 10, 2005
Sold by
Black Dawn D
Bought by
Black Cody J and Black Dawn D
Home Financials for this Owner
Home Financials are based on the most recent Mortgage that was taken out on this home.
Original Mortgage
$108,400
Interest Rate
5%
Mortgage Type
New Conventional
Create a Home Valuation Report for This Property
The Home Valuation Report is an in-depth analysis detailing your home's value as well as a comparison with similar homes in the area
Home Values in the Area
Average Home Value in this Area
Purchase History
| Date | Buyer | Sale Price | Title Company |
|---|---|---|---|
| Maughan Jordan | -- | Advanced Title | |
| Black Cody J | -- | American Secure Title | |
| Black Dawn D | -- | American Secure Title |
Source: Public Records
Mortgage History
| Date | Status | Borrower | Loan Amount |
|---|---|---|---|
| Open | Maughan Jordan | $175,510 | |
| Previous Owner | Black Dawn D | $108,400 | |
| Previous Owner | Black Dawn D | $20,325 |
Source: Public Records
Tax History Compared to Growth
Tax History
| Year | Tax Paid | Tax Assessment Tax Assessment Total Assessment is a certain percentage of the fair market value that is determined by local assessors to be the total taxable value of land and additions on the property. | Land | Improvement |
|---|---|---|---|---|
| 2025 | $1,752 | $232,285 | $0 | $0 |
| 2024 | $1,566 | $194,925 | $0 | $0 |
| 2023 | $1,643 | $191,450 | $0 | $0 |
| 2022 | $1,710 | $191,450 | $0 | $0 |
| 2021 | $1,695 | $288,805 | $68,250 | $220,555 |
| 2020 | $1,597 | $264,325 | $68,250 | $196,075 |
| 2019 | $1,675 | $264,325 | $68,250 | $196,075 |
| 2018 | $1,381 | $212,600 | $42,100 | $170,500 |
| 2017 | $1,329 | $108,405 | $0 | $0 |
| 2016 | $1,344 | $99,935 | $0 | $0 |
| 2015 | $1,146 | $93,065 | $0 | $0 |
| 2014 | $1,120 | $93,065 | $0 | $0 |
| 2013 | -- | $96,740 | $0 | $0 |
Source: Public Records
Map
Nearby Homes
- 3054 S 1000 W
- 3070 S 1000 W Unit 81
- 3070 S 1000 W
- 3038 S 1000 W
- 996 W 3020 S
- 996 W 3020 S Unit 84
- 998 W 3020 S Unit 83
- 3084 S 1000 W Unit 80
- 3084 S 1000 W
- 3055 S 1000 W
- 3039 S 1000 W
- 3071 S 1000 W
- 997 W 3020 S Unit 85
- 3023 S 1000 W
- 3008 S 1000 W
- 3098 S 1000 W
- 3098 S 1000 W Unit 79
- 3085 S 1000 W
- 3099 S 1000 W
- 3007 S 1000 W Unit 63