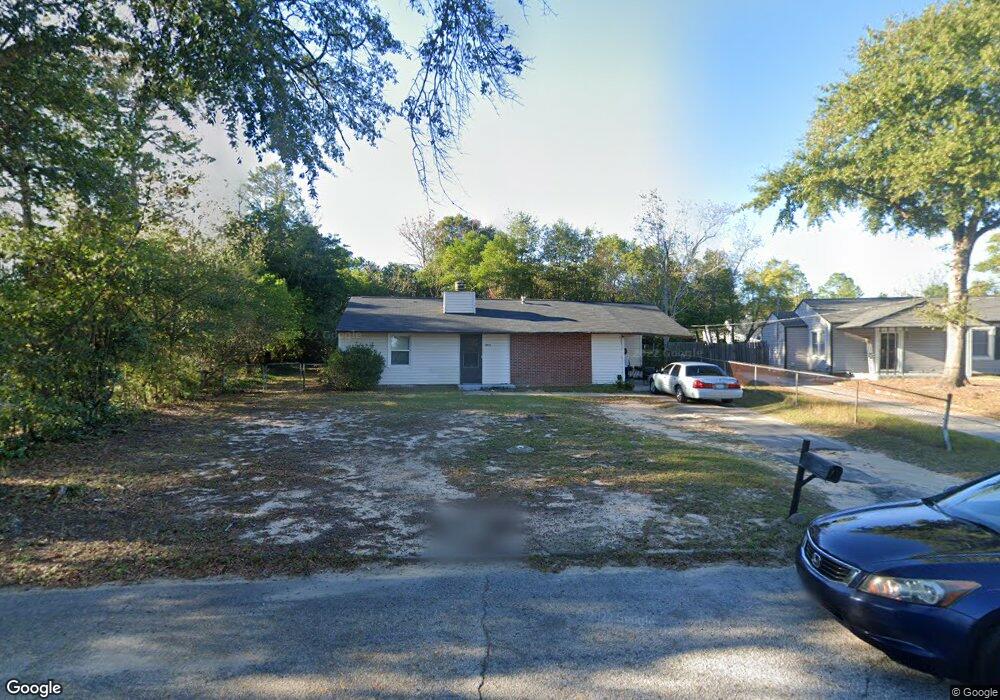
3055 Acorn Rd Augusta, GA 30906
Wheeless Road NeighborhoodEstimated Value: $116,000 - $139,000
3
Beds
2
Baths
1,334
Sq Ft
$96/Sq Ft
Est. Value
About This Home
This home is located at 3055 Acorn Rd, Augusta, GA 30906 and is currently estimated at $128,459, approximately $96 per square foot. 3055 Acorn Rd is a home located in Richmond County with nearby schools including Murphey Middle School, Johnson Magnet, and Josey High School.
Ownership History
Date
Name
Owned For
Owner Type
Purchase Details
Closed on
Jul 13, 2006
Sold by
Parks Jimmy and Parks Marsha R
Bought by
Swinson Sylvia D
Current Estimated Value
Home Financials for this Owner
Home Financials are based on the most recent Mortgage that was taken out on this home.
Original Mortgage
$54,900
Outstanding Balance
$31,810
Interest Rate
6.6%
Mortgage Type
Purchase Money Mortgage
Estimated Equity
$96,649
Purchase Details
Closed on
Sep 8, 2000
Sold by
Va
Bought by
Parks Jimmy and Parks Marsha R
Home Financials for this Owner
Home Financials are based on the most recent Mortgage that was taken out on this home.
Original Mortgage
$43,200
Interest Rate
8.11%
Mortgage Type
Seller Take Back
Purchase Details
Closed on
Nov 2, 1999
Sold by
First Nationwide Mtg Corp
Bought by
Va
Purchase Details
Closed on
Nov 4, 1986
Sold by
Lapaquette Teru Kay
Bought by
Beard Jerry L Beard Joann C
Purchase Details
Closed on
Oct 1, 1986
Sold by
Lapaquette Teru Kay
Bought by
Beard Jerry L
Purchase Details
Closed on
Apr 1, 1980
Create a Home Valuation Report for This Property
The Home Valuation Report is an in-depth analysis detailing your home's value as well as a comparison with similar homes in the area
Home Values in the Area
Average Home Value in this Area
Purchase History
| Date | Buyer | Sale Price | Title Company |
|---|---|---|---|
| Swinson Sylvia D | $61,000 | None Available | |
| Parks Jimmy | $48,000 | -- | |
| Parks Jimmy | -- | -- | |
| Va | -- | -- | |
| First Nationwide Mtg Corp | $46,460 | -- | |
| -- | $46,500 | -- | |
| Beard Jerry L Beard Joann C | $40,900 | -- | |
| Beard Jerry L | $40,900 | -- | |
| -- | $39,900 | -- |
Source: Public Records
Mortgage History
| Date | Status | Borrower | Loan Amount |
|---|---|---|---|
| Open | Swinson Sylvia D | $54,900 | |
| Previous Owner | Parks Jimmy | $43,200 |
Source: Public Records
Tax History
| Year | Tax Paid | Tax Assessment Tax Assessment Total Assessment is a certain percentage of the fair market value that is determined by local assessors to be the total taxable value of land and additions on the property. | Land | Improvement |
|---|---|---|---|---|
| 2025 | $1,824 | $43,576 | $2,918 | $40,658 |
| 2024 | $1,824 | $39,680 | $2,918 | $36,762 |
| 2023 | $1,595 | $41,584 | $2,918 | $38,666 |
| 2022 | $1,286 | $31,792 | $2,918 | $28,874 |
| 2021 | $1,099 | $22,902 | $2,918 | $19,984 |
| 2020 | $1,078 | $22,624 | $2,918 | $19,706 |
| 2019 | $1,128 | $22,624 | $2,918 | $19,706 |
| 2018 | $1,227 | $22,624 | $2,918 | $19,706 |
| 2017 | $1,072 | $22,624 | $2,918 | $19,706 |
| 2016 | $1,072 | $22,625 | $2,918 | $19,706 |
| 2015 | $1,078 | $22,625 | $2,918 | $19,706 |
| 2014 | $1,079 | $22,625 | $2,918 | $19,706 |
Source: Public Records
Map
Nearby Homes
- 3042 Acorn Rd
- 2444 Ridge Rd
- 2438 N Carolina Ave
- 2567 Lyman St
- 3010 Acorn Rd
- 2558 Lyman St
- 2537 Lyman St
- 2533 Lyman St
- 2704 Deen Ave
- 3042 Collier Rd
- 2550 Wheeless Rd
- 3106 Truxton Rd
- 3015 Thomas Ln
- 2393 Wheeless Rd
- 2905 Rocky Creek Rd
- 2391 Wheeless Rd
- 2529 Norton Blvd
- 2411 Ruby Dr
- 3024 Sprucewood Dr
- 2349 Henry Cir
- 3053 Acorn Rd
- 3057 Acorn Rd
- 3054 Hawthorne Dr
- 3056 Hawthorne Dr
- 2474 Golden Camp Rd
- 3052 Hawthorne Dr
- 3051 Acorn Rd
- 3058 Hawthorne Dr
- 3050 Hawthorne Dr
- 3052 Acorn Rd
- 3049 Acorn Rd
- 3060 Hawthorne Dr
- 3048 Hawthorne Dr
- 3050 Acorn Rd
- 3047 Acorn Rd
- 3051 Hawthorne Dr
- 3053 Hawthorne Dr
- 3046 Hawthorne Dr
- 2459 Sumac Dr
- 3055 Hawthorne Dr