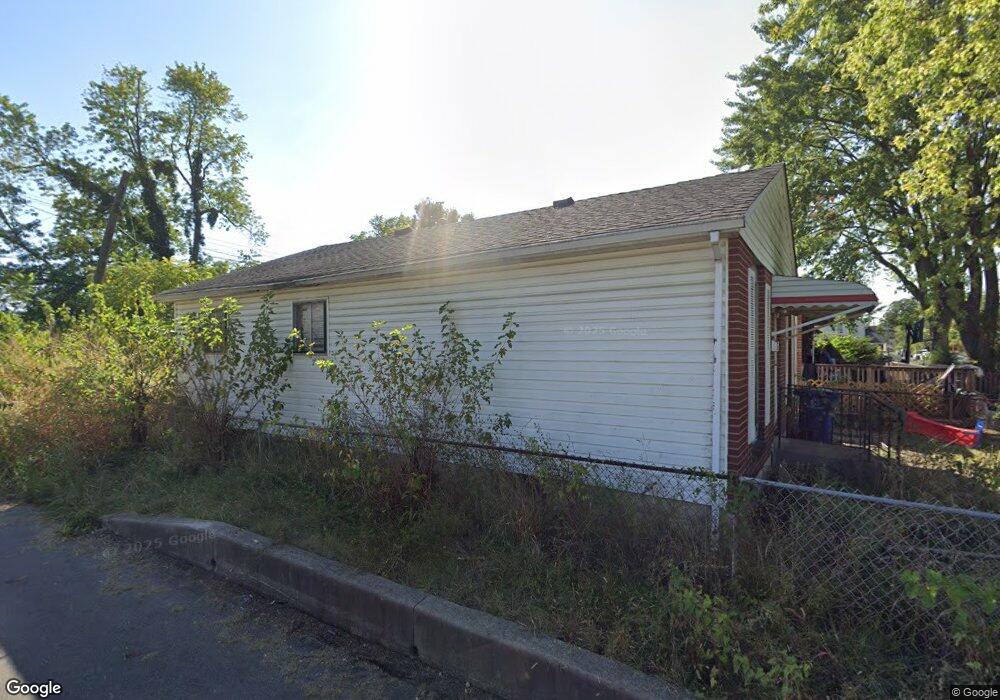
3055 E 6th Ave Columbus, OH 43219
Estimated Value: $119,000 - $138,000
3
Beds
1
Bath
925
Sq Ft
$137/Sq Ft
Est. Value
About This Home
This home is located at 3055 E 6th Ave, Columbus, OH 43219 and is currently estimated at $126,272, approximately $136 per square foot. 3055 E 6th Ave is a home located in Franklin County with nearby schools including East Columbus Elementary School, Champion Middle School, and East High School.
Ownership History
Date
Name
Owned For
Owner Type
Purchase Details
Closed on
May 27, 2024
Sold by
Sheriff/Franklin County Ohio
Bought by
Yusuf Abdisamad
Current Estimated Value
Purchase Details
Closed on
Nov 12, 2020
Sold by
Estate Of Marie M Mitchell
Bought by
Fullington Sheila Mitchell and Howard Shirlene Lavender
Purchase Details
Closed on
Oct 21, 2020
Sold by
Fullington Sheila Mitchell
Bought by
Mitchell Keith F
Purchase Details
Closed on
Oct 5, 2020
Sold by
Mitchell Wensor
Bought by
Mitchell Keith F
Purchase Details
Closed on
Sep 4, 2020
Sold by
Mitchell Celestine
Bought by
Mitchell Keith F
Purchase Details
Closed on
Jun 28, 1993
Purchase Details
Closed on
Nov 1, 1984
Create a Home Valuation Report for This Property
The Home Valuation Report is an in-depth analysis detailing your home's value as well as a comparison with similar homes in the area
Home Values in the Area
Average Home Value in this Area
Purchase History
| Date | Buyer | Sale Price | Title Company |
|---|---|---|---|
| Yusuf Abdisamad | $80,800 | None Listed On Document | |
| Fullington Sheila Mitchell | -- | None Available | |
| Mitchell Keith F | -- | Schobert Catherine | |
| Mitchell Keith F | $8,200 | None Available | |
| Mitchell Keith F | $8,200 | None Available | |
| Mitchell Keith F | $8,200 | None Available | |
| Mitchell Keith F | $8,200 | None Available | |
| -- | $30,300 | -- | |
| -- | -- | -- |
Source: Public Records
Tax History
| Year | Tax Paid | Tax Assessment Tax Assessment Total Assessment is a certain percentage of the fair market value that is determined by local assessors to be the total taxable value of land and additions on the property. | Land | Improvement |
|---|---|---|---|---|
| 2025 | $1,902 | $37,810 | $7,600 | $30,210 |
| 2024 | $1,902 | $37,810 | $7,600 | $30,210 |
| 2023 | $1,675 | $37,810 | $7,600 | $30,210 |
| 2022 | $1,070 | $14,250 | $1,260 | $12,990 |
| 2021 | $996 | $14,250 | $1,260 | $12,990 |
| 2020 | $844 | $14,250 | $1,260 | $12,990 |
| 2019 | $775 | $12,780 | $1,160 | $11,620 |
| 2018 | $484 | $12,780 | $1,160 | $11,620 |
| 2017 | $775 | $12,780 | $1,160 | $11,620 |
| 2016 | $213 | $11,970 | $1,540 | $10,430 |
| 2015 | $194 | $11,970 | $1,540 | $10,430 |
| 2014 | $194 | $11,970 | $1,540 | $10,430 |
| 2013 | $158 | $14,070 | $1,820 | $12,250 |
Source: Public Records
Map
Nearby Homes
- 00 E 7th Ave
- 0 E 7th Ave Unit Lot 79 225013171
- 0 E 7th Ave Unit Lot 77 225013170
- 0 E 7th Ave Unit Lot 78 225013168
- 2974 E 7th Ave
- 3288 E 5th Ave
- 2969 E 11th Ave
- 3237 E 12th Ave
- 2841 E 10th Ave
- 3123 E 13th Ave
- 2822 Bellwood Ave
- 2814 E 9th Ave
- 2779 Columbus Ave
- 696 Northview Ave
- 238 Edgevale Rd
- 205 N Gould Rd
- 256 N Kellner Rd
- 180 N Harding Rd
- 243 N James Rd
- 253 N James Rd
- 3051 E 6th Ave
- 3047 E 6th Ave
- 688 N Gould Rd
- 3043 E 6th Ave
- 3048 E 5th Ave
- 3060 E 5th Ave Unit 64
- 3060-3064 E 5th Ave
- 3042 E 5th Ave
- 3035 E 6th Ave
- 3085 E 6th Ave
- 3068 E 5th Ave
- 3050 E 6th Ave
- 3044 E 6th Ave
- 3066 E 6th Ave
- 3072 E 5th Ave
- 3087 E 6th Ave
- 3027 E 6th Ave
- 3078 E 5th Ave
- 3074-3080 E 6th Ave
- 3074 E 6th Ave
Your Personal Tour Guide
Ask me questions while you tour the home.