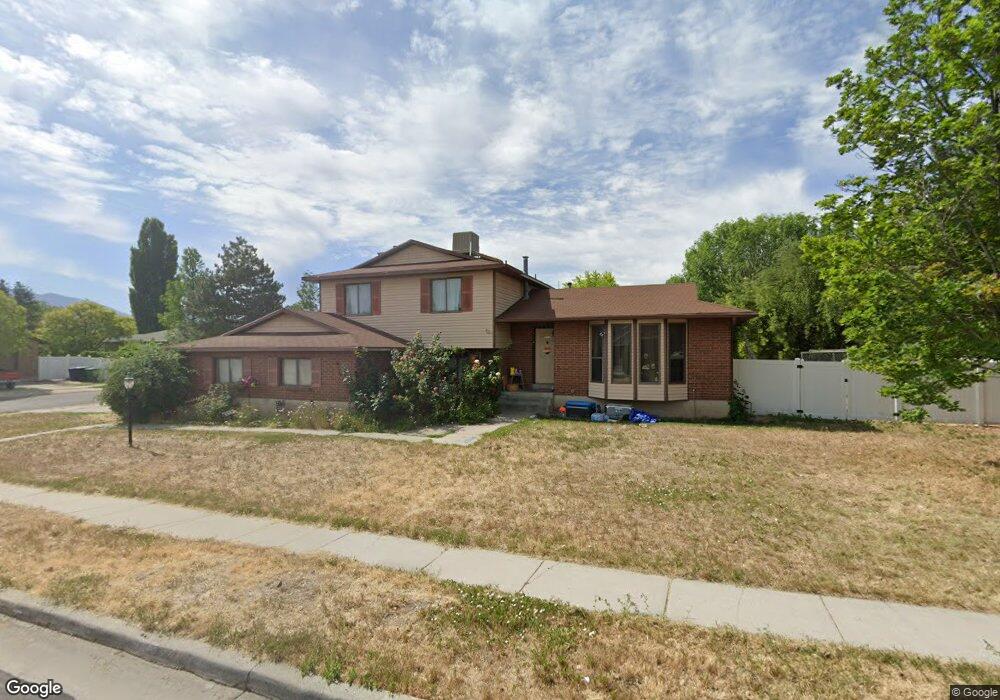
3055 Laytham Way West Jordan, UT 84088
Edenbrooke NeighborhoodEstimated Value: $505,000 - $621,000
4
Beds
2
Baths
2,243
Sq Ft
$243/Sq Ft
Est. Value
About This Home
This home is located at 3055 Laytham Way, West Jordan, UT 84088 and is currently estimated at $545,996, approximately $243 per square foot. 3055 Laytham Way is a home located in Salt Lake County with nearby schools including Westvale Elementary School, Joel P. Jensen Middle School, and West Jordan High School.
Ownership History
Date
Name
Owned For
Owner Type
Purchase Details
Closed on
May 20, 2005
Sold by
Harrison William Herman and Harrison Angela J
Bought by
Mcquillan Matthew A and Mcquillan Cynthia B
Current Estimated Value
Home Financials for this Owner
Home Financials are based on the most recent Mortgage that was taken out on this home.
Original Mortgage
$136,800
Outstanding Balance
$71,328
Interest Rate
5.84%
Mortgage Type
New Conventional
Estimated Equity
$474,668
Purchase Details
Closed on
Dec 10, 1997
Sold by
Harrison William Herman
Bought by
Harrison William Herman and Harrison Angela J
Home Financials for this Owner
Home Financials are based on the most recent Mortgage that was taken out on this home.
Original Mortgage
$115,000
Interest Rate
7.19%
Purchase Details
Closed on
May 6, 1994
Sold by
Cruz Mar K and Cruz Brenda H
Bought by
Harrison William Herman
Home Financials for this Owner
Home Financials are based on the most recent Mortgage that was taken out on this home.
Original Mortgage
$98,000
Interest Rate
7.84%
Create a Home Valuation Report for This Property
The Home Valuation Report is an in-depth analysis detailing your home's value as well as a comparison with similar homes in the area
Home Values in the Area
Average Home Value in this Area
Purchase History
| Date | Buyer | Sale Price | Title Company |
|---|---|---|---|
| Mcquillan Matthew A | -- | Backman Title Services | |
| Harrison William Herman | -- | -- | |
| Harrison William Herman | -- | -- |
Source: Public Records
Mortgage History
| Date | Status | Borrower | Loan Amount |
|---|---|---|---|
| Open | Mcquillan Matthew A | $136,800 | |
| Previous Owner | Harrison William Herman | $115,000 | |
| Previous Owner | Harrison William Herman | $98,000 |
Source: Public Records
Tax History Compared to Growth
Tax History
| Year | Tax Paid | Tax Assessment Tax Assessment Total Assessment is a certain percentage of the fair market value that is determined by local assessors to be the total taxable value of land and additions on the property. | Land | Improvement |
|---|---|---|---|---|
| 2025 | $2,443 | $485,100 | $155,900 | $329,200 |
| 2024 | $2,443 | $470,100 | $150,900 | $319,200 |
| 2023 | $2,425 | $439,700 | $147,900 | $291,800 |
| 2022 | $2,510 | $447,700 | $145,000 | $302,700 |
| 2021 | $2,117 | $343,800 | $106,000 | $237,800 |
| 2020 | $1,980 | $301,700 | $96,000 | $205,700 |
| 2019 | $2,000 | $298,900 | $96,000 | $202,900 |
| 2018 | $1,850 | $274,200 | $92,600 | $181,600 |
| 2017 | $1,702 | $251,200 | $92,600 | $158,600 |
| 2016 | $1,667 | $231,100 | $92,600 | $138,500 |
| 2015 | $1,743 | $235,600 | $99,700 | $135,900 |
| 2014 | $1,675 | $223,000 | $95,300 | $127,700 |
Source: Public Records
Map
Nearby Homes
- 2883 Jana Lee Dr
- 9294 S 2700 W
- 2970 W 8870 S
- 1967 W 9350 S
- 2636 W 9110 S
- 3214 W Monterey Pine Ln
- 8886 S 2700 W
- 3256 Star Fire Rd
- 9178 Lisa Ave
- 2286 Williamsburg Cir
- 4000 W 8400 S Unit 83
- 9441 S Newkirk St
- 9526 Ember Glow Ct Unit C
- 9566 Ember Glow Ct Unit C
- 2223 W Williamsburg Cir
- 3750 W Bingham Creek Dr
- 3702 W Angus Dr
- 2177 W 9240 S
- 8493 S 3200 W
- 2116 W Abbey View Rd
- 9172 Seaton Place
- 3071 Laytham Way
- 9171 S Saxby Place
- 9171 Saxby Place
- 3046 Laytham Way
- 3015 Laytham Way
- 3062 W Laytham Way
- 3062 Laytham Way
- 9184 Seaton Place
- 3030 W Laytham Way
- 3030 Laytham Way
- 9171 Seaton Place
- 3078 W Laytham Way
- 3078 Laytham Way
- 9183 Saxby Place
- 3014 W 9145 S
- 9183 Seaton Place
- 3014 Laytham Way
- 9110 Wimbleton Place
- 3092 W Laytham Way