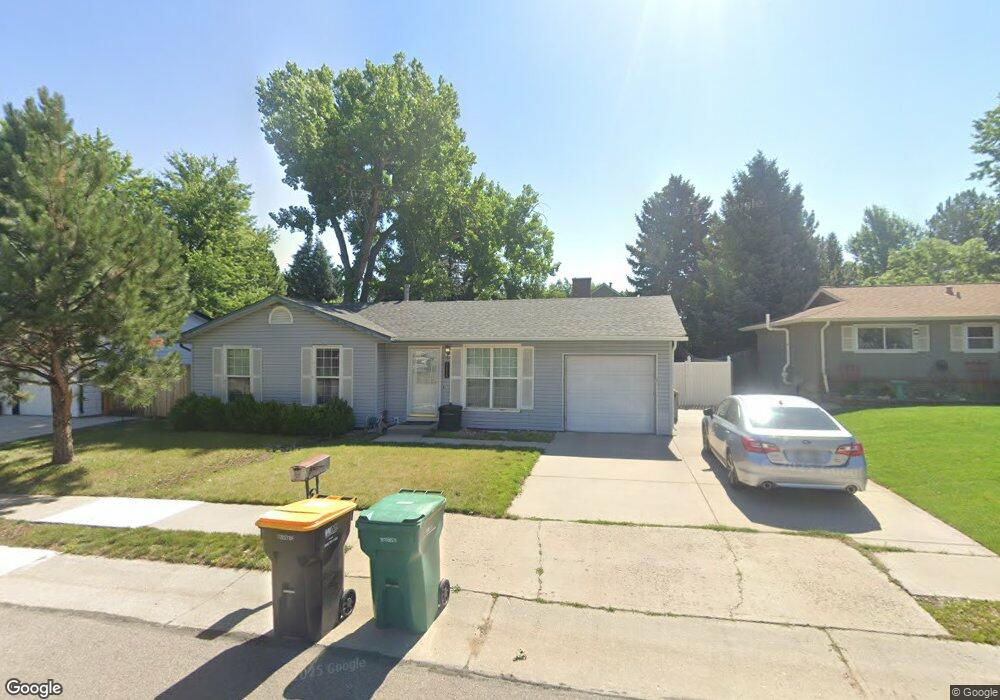
3056 S Garland Ct Lakewood, CO 80227
Bear Creek NeighborhoodEstimated Value: $498,139 - $571,000
5
Beds
3
Baths
993
Sq Ft
$526/Sq Ft
Est. Value
About This Home
This home is located at 3056 S Garland Ct, Lakewood, CO 80227 and is currently estimated at $522,785, approximately $526 per square foot. 3056 S Garland Ct is a home located in Jefferson County with nearby schools including Bear Creek K-8 School, Carmody Middle School, and Bear Creek High School.
Ownership History
Date
Name
Owned For
Owner Type
Purchase Details
Closed on
Apr 27, 2007
Sold by
Bracken Scott and Bracken Valarie M
Bought by
Mohrman Michelle L
Current Estimated Value
Home Financials for this Owner
Home Financials are based on the most recent Mortgage that was taken out on this home.
Original Mortgage
$164,800
Outstanding Balance
$100,024
Interest Rate
6.13%
Mortgage Type
Purchase Money Mortgage
Estimated Equity
$422,761
Purchase Details
Closed on
Sep 7, 2005
Sold by
Cruz Oscar A and Cruz Ana Maria
Bought by
Bracken Scott and Bracken Valarie M
Home Financials for this Owner
Home Financials are based on the most recent Mortgage that was taken out on this home.
Original Mortgage
$169,600
Interest Rate
6%
Mortgage Type
Credit Line Revolving
Purchase Details
Closed on
Jan 25, 2001
Sold by
Honnold Clarence F Honnold Sharon L
Bought by
Cruz Oscar A and Cruz Ana Maria
Home Financials for this Owner
Home Financials are based on the most recent Mortgage that was taken out on this home.
Original Mortgage
$167,532
Interest Rate
7.21%
Mortgage Type
FHA
Create a Home Valuation Report for This Property
The Home Valuation Report is an in-depth analysis detailing your home's value as well as a comparison with similar homes in the area
Home Values in the Area
Average Home Value in this Area
Purchase History
| Date | Buyer | Sale Price | Title Company |
|---|---|---|---|
| Mohrman Michelle L | $212,000 | Land Title Guarantee Company | |
| Bracken Scott | $212,000 | Land Title Guarantee Company | |
| Cruz Oscar A | $169,900 | -- |
Source: Public Records
Mortgage History
| Date | Status | Borrower | Loan Amount |
|---|---|---|---|
| Open | Mohrman Michelle L | $164,800 | |
| Previous Owner | Bracken Scott | $169,600 | |
| Previous Owner | Cruz Oscar A | $167,532 |
Source: Public Records
Tax History Compared to Growth
Tax History
| Year | Tax Paid | Tax Assessment Tax Assessment Total Assessment is a certain percentage of the fair market value that is determined by local assessors to be the total taxable value of land and additions on the property. | Land | Improvement |
|---|---|---|---|---|
| 2024 | $2,735 | $29,115 | $13,462 | $15,653 |
| 2023 | $2,735 | $29,115 | $13,462 | $15,653 |
| 2022 | $2,518 | $26,135 | $11,417 | $14,718 |
| 2021 | $2,548 | $26,888 | $11,746 | $15,142 |
| 2020 | $2,240 | $23,701 | $9,472 | $14,229 |
| 2019 | $2,207 | $23,701 | $9,472 | $14,229 |
| 2018 | $1,932 | $20,033 | $5,948 | $14,085 |
| 2017 | $1,704 | $20,033 | $5,948 | $14,085 |
| 2016 | $1,650 | $18,171 | $5,610 | $12,561 |
| 2015 | $1,343 | $18,171 | $5,610 | $12,561 |
| 2014 | $1,343 | $13,507 | $5,300 | $8,207 |
Source: Public Records
Map
Nearby Homes
- 9541 W Cornell Place
- 9025 W Bear Creek Dr Unit 6
- 3225 S Garrison St Unit 9
- 8960 W Dartmouth Place
- 8879 W Floyd Ave
- 8866 W Dartmouth Place
- 8855 W Bear Creek Dr
- 3355 S Flower St Unit 56
- 3355 S Flower St Unit 106
- 3355 S Flower St Unit 74
- 3147 S Estes St
- 3121 S Estes St
- 8747 W Cornell Ave Unit 5
- 8783 W Cornell Ave Unit 8
- 3354 S Flower St Unit 52
- 2501 S Kipling St
- 8598 W Dartmouth Place
- 3351 S Field St Unit 99
- 3351 S Field St Unit 164
- 9022 W Washburn Place
- 3062 S Garland Ct
- 3046 S Garland Ct
- 3037 S Flower Ct
- 3066 S Garland Ct
- 3027 S Flower Ct
- 3036 S Garland Ct
- 3047 S Flower Ct
- 3057 S Garland Ct
- 3067 S Garland Ct
- 3017 S Flower Ct
- 9323 W Columbia Place
- 3082 S Garland Ct
- 3026 S Garland Ct
- 3077 S Garland Ct
- 9353 W Columbia Place
- 3058 S Holland Ct
- 3086 S Garland Ct
- 3016 S Garland Ct
- 9322 W Cornell Place
- 3064 S Holland Ct