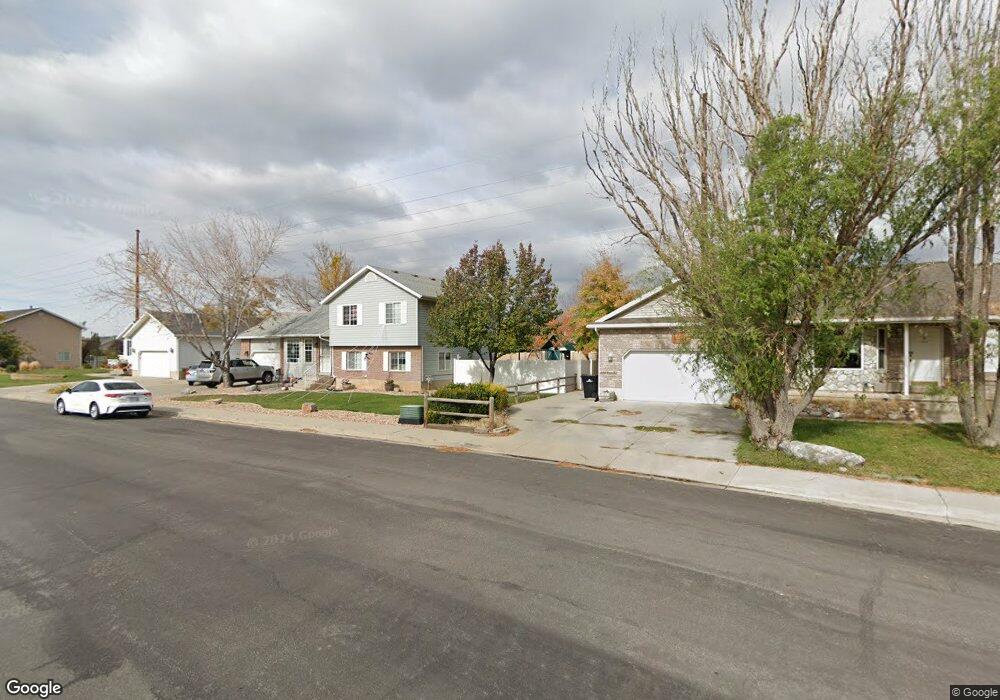
3057 E 1300 S Spanish Fork, UT 84660
Estimated Value: $474,160 - $489,000
3
Beds
2
Baths
2,156
Sq Ft
$223/Sq Ft
Est. Value
About This Home
This home is located at 3057 E 1300 S, Spanish Fork, UT 84660 and is currently estimated at $481,053, approximately $223 per square foot. 3057 E 1300 S is a home located in Utah County with nearby schools including Spanish Oaks Elementary School, Mapleton Junior High School, and Maple Mountain High School.
Ownership History
Date
Name
Owned For
Owner Type
Purchase Details
Closed on
Jun 27, 2001
Sold by
Federal National Mortgage Association
Bought by
Davis David K and Davis Shelly V
Current Estimated Value
Home Financials for this Owner
Home Financials are based on the most recent Mortgage that was taken out on this home.
Original Mortgage
$104,500
Outstanding Balance
$40,272
Interest Rate
7.14%
Estimated Equity
$440,781
Purchase Details
Closed on
Mar 23, 2001
Sold by
Johnson Draper Thomas Carson and Johnson Draper Yvonne
Bought by
Federal National Mortgage Association
Purchase Details
Closed on
Jul 19, 1996
Sold by
Taylor Turner Properties L C
Bought by
Johnson Draper Thomas Carson and Johnson Draper Yvonee
Home Financials for this Owner
Home Financials are based on the most recent Mortgage that was taken out on this home.
Original Mortgage
$29,100
Interest Rate
8.3%
Mortgage Type
Seller Take Back
Create a Home Valuation Report for This Property
The Home Valuation Report is an in-depth analysis detailing your home's value as well as a comparison with similar homes in the area
Home Values in the Area
Average Home Value in this Area
Purchase History
| Date | Buyer | Sale Price | Title Company |
|---|---|---|---|
| Davis David K | -- | Empire Land Title Company | |
| Federal National Mortgage Association | $137,414 | Backman Stewart Title Servi | |
| Johnson Draper Thomas Carson | -- | -- |
Source: Public Records
Mortgage History
| Date | Status | Borrower | Loan Amount |
|---|---|---|---|
| Open | Davis David K | $104,500 | |
| Previous Owner | Johnson Draper Thomas Carson | $29,100 | |
| Closed | Johnson Draper Thomas Carson | $88,727 |
Source: Public Records
Tax History
| Year | Tax Paid | Tax Assessment Tax Assessment Total Assessment is a certain percentage of the fair market value that is determined by local assessors to be the total taxable value of land and additions on the property. | Land | Improvement |
|---|---|---|---|---|
| 2025 | $2,248 | $245,520 | -- | -- |
| 2024 | $2,248 | $231,660 | $0 | $0 |
| 2023 | $2,271 | $234,300 | $0 | $0 |
| 2022 | $2,316 | $234,355 | $0 | $0 |
| 2021 | $1,926 | $311,900 | $123,000 | $188,900 |
| 2020 | $1,821 | $286,700 | $111,800 | $174,900 |
| 2019 | $1,601 | $265,100 | $93,200 | $171,900 |
| 2018 | $1,484 | $237,500 | $88,000 | $149,500 |
| 2017 | $1,378 | $118,525 | $0 | $0 |
| 2016 | $1,292 | $109,725 | $0 | $0 |
| 2015 | $1,233 | $103,455 | $0 | $0 |
| 2014 | $1,205 | $101,420 | $0 | $0 |
Source: Public Records
Map
Nearby Homes
- 3074 E Canyon Meadows Dr
- 3056 E Canyon Meadows Dr Unit 330
- 3117 Somerset Village Way
- 3032 E Canyon Meadows Dr Unit 331
- 3147 E 1530 S
- 3013 E Canyon Meadows Dr Unit 314
- 3186 E 1350 S
- 3095 E Somerset Dr
- 2984 E Canyon Meadows Dr
- 2972 E Canyon Meadows Dr Unit 335
- 1551 S 3170 E
- 3154 E Canyon Meadows Dr
- 3134 E Canyon Meadows Dr
- 1627 S 3050 E
- 1617 S Oak View Ln
- 804 E 1610 S Unit 91
- 824 E 1610 S Unit 92
- 3134 E Canyon Crest Dr Unit 326
- 3103 E 1000 S Unit 303
- 3103 E 1000 S
- 3075 E 1300 S
- 3117 E Canyon Rd
- 3039 E 1300 S
- 3143 E 1480 S
- 3077 E 1480 S
- 3102 E Canyon Meadows Dr
- 3100 E 1480 S Unit 55-C
- 3021 E 1300 S
- 3096 E Canyon Meadows Rd
- 3087 E Canyon Rd
- 3092 Somerset Village Way
- 3092 E 1210 S
- 3092 Somerset Village Way Unit 6
- 3083 E Canyon Rd
- 3098 Somerset Village Way
- 3084 Somerset Village Way
- 3114 Somerset Village Way
- 3114 E Somerset Dr
- 3076 Somerset Village Way
- 3059 E 1480 S
Your Personal Tour Guide
Ask me questions while you tour the home.