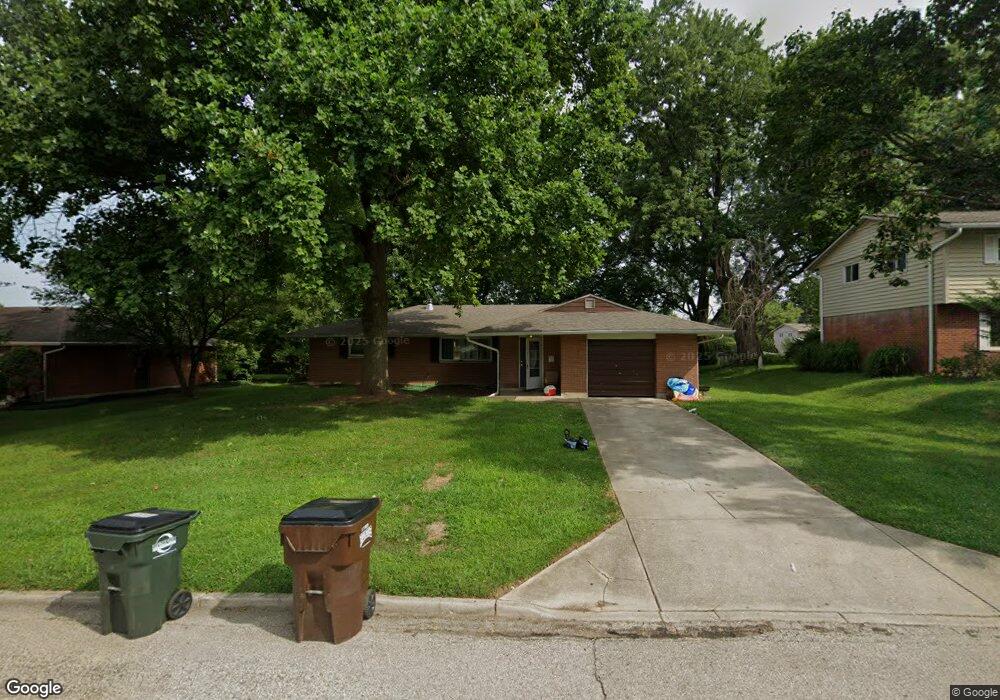
3057 Glenmere Ct Dayton, OH 45440
Estimated Value: $254,000 - $287,000
3
Beds
1
Bath
1,480
Sq Ft
$181/Sq Ft
Est. Value
About This Home
This home is located at 3057 Glenmere Ct, Dayton, OH 45440 and is currently estimated at $267,391, approximately $180 per square foot. 3057 Glenmere Ct is a home located in Montgomery County with nearby schools including Prass Elementary School, Kettering Middle School, and Kettering Fairmont High School.
Ownership History
Date
Name
Owned For
Owner Type
Purchase Details
Closed on
Apr 28, 2021
Sold by
Ryczek Cassandra and Ryczek Christopher
Bought by
Sargent Gwendolyn
Current Estimated Value
Purchase Details
Closed on
Feb 24, 2021
Sold by
Sargent Gwendolyn and 3057 Glenmere Court Land Trust
Bought by
Mckenzie Family Properties Llc
Purchase Details
Closed on
Dec 24, 2020
Sold by
Ryczek Christopher E
Bought by
Sargent Gwendolyn and 3057 Glenmere Court Land Trust
Purchase Details
Closed on
Apr 21, 2010
Sold by
Dunn Deborah
Bought by
Ryczek Christopher E and Ryczek Cassandra J
Home Financials for this Owner
Home Financials are based on the most recent Mortgage that was taken out on this home.
Original Mortgage
$110,000
Interest Rate
6%
Mortgage Type
Seller Take Back
Purchase Details
Closed on
Nov 11, 1996
Sold by
Mckenzie Delia
Bought by
Dunn Deborah
Create a Home Valuation Report for This Property
The Home Valuation Report is an in-depth analysis detailing your home's value as well as a comparison with similar homes in the area
Home Values in the Area
Average Home Value in this Area
Purchase History
| Date | Buyer | Sale Price | Title Company |
|---|---|---|---|
| Sargent Gwendolyn | -- | None Available | |
| Mckenzie Family Properties Llc | -- | None Available | |
| Sargent Gwendolyn | -- | None Available | |
| Ryczek Christopher E | $115,000 | None Available | |
| Dunn Deborah | -- | -- |
Source: Public Records
Mortgage History
| Date | Status | Borrower | Loan Amount |
|---|---|---|---|
| Previous Owner | Ryczek Christopher E | $110,000 |
Source: Public Records
Tax History Compared to Growth
Tax History
| Year | Tax Paid | Tax Assessment Tax Assessment Total Assessment is a certain percentage of the fair market value that is determined by local assessors to be the total taxable value of land and additions on the property. | Land | Improvement |
|---|---|---|---|---|
| 2024 | $4,283 | $66,980 | $13,090 | $53,890 |
| 2023 | $4,283 | $66,980 | $13,090 | $53,890 |
| 2022 | $4,318 | $53,410 | $10,480 | $42,930 |
| 2021 | $4,003 | $53,410 | $10,480 | $42,930 |
| 2020 | $5,112 | $53,410 | $10,480 | $42,930 |
| 2019 | $3,722 | $43,730 | $10,480 | $33,250 |
| 2018 | $3,742 | $43,730 | $10,480 | $33,250 |
| 2017 | $3,458 | $43,730 | $10,480 | $33,250 |
| 2016 | $3,220 | $38,210 | $10,480 | $27,730 |
| 2015 | $3,082 | $38,210 | $10,480 | $27,730 |
| 2014 | $3,082 | $38,210 | $10,480 | $27,730 |
| 2012 | -- | $34,340 | $10,490 | $23,850 |
Source: Public Records
Map
Nearby Homes
- 3073 Santa Rosa Dr
- 3033 Glenmere Ct
- 3170 E Stroop Rd Unit 307
- 4489 Bucksport Ct
- 364 Weathersfield Dr
- 2841 Corlington Dr
- 2816 Corlington Dr
- 470 Cloverhill Ct
- 4086 Glenheath Dr
- 4224 Fernbrook St
- 2510 E Stroop Rd
- 2409 Burning Tree Dr
- 861 Acorn Dr
- 4464 Woodner Dr
- 2233 Cherry Oak Dr
- 3034 Sandywood Dr
- 3116 Powhattan Place
- 2648 Parklawn Dr
- 4533 Drayton Ct
- 2512 Olson Dr
- 3065 Glenmere Ct
- 3049 Glenmere Ct
- 3073 Glenmere Ct
- 3072 Santa Rosa Dr
- 3084 Santa Rosa Dr
- 3041 Glenmere Ct
- 3060 Santa Rosa Dr
- 3096 Santa Rosa Dr
- 3048 Glenmere Ct
- 3056 Glenmere Ct
- 3064 Glenmere Ct
- 3048 Santa Rosa Dr
- 3081 Glenmere Ct
- 3032 Glenmere Ct
- 3100 Santa Rosa Dr
- 3036 Santa Rosa Dr
- 3072 Glenmere Ct
- 3112 Santa Rosa Dr
- 3089 Glenmere Ct
- 3025 Glenmere Ct