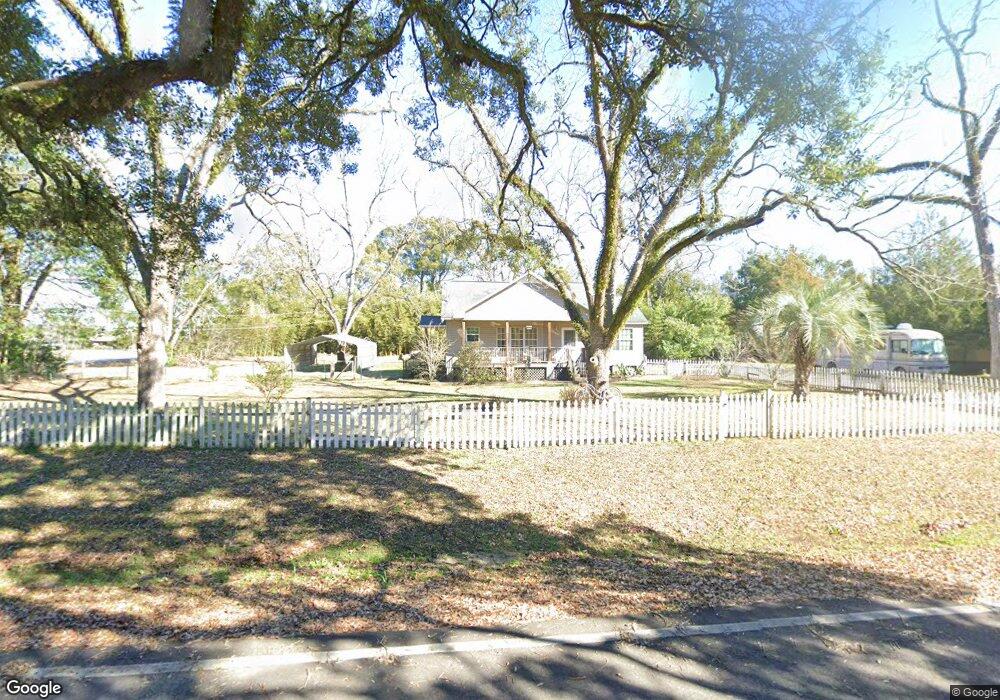
3058 Broad St Metcalf, GA 31792
Estimated Value: $131,000 - $239,000
3
Beds
2
Baths
1,102
Sq Ft
$172/Sq Ft
Est. Value
About This Home
This home is located at 3058 Broad St, Metcalf, GA 31792 and is currently estimated at $189,903, approximately $172 per square foot. 3058 Broad St is a home located in Thomas County with nearby schools including Hand in Hand Primary School, Garrison-Pilcher Elementary School, and Cross Creek Elementary School.
Ownership History
Date
Name
Owned For
Owner Type
Purchase Details
Closed on
Sep 19, 2022
Sold by
Delarber Construction Llc
Bought by
Young Aletha Dawn
Current Estimated Value
Home Financials for this Owner
Home Financials are based on the most recent Mortgage that was taken out on this home.
Original Mortgage
$95,959
Outstanding Balance
$91,589
Interest Rate
5.13%
Mortgage Type
New Conventional
Estimated Equity
$98,314
Purchase Details
Closed on
Aug 24, 2022
Sold by
That Llc
Bought by
Gth Equity Llc
Home Financials for this Owner
Home Financials are based on the most recent Mortgage that was taken out on this home.
Original Mortgage
$95,959
Outstanding Balance
$91,589
Interest Rate
5.13%
Mortgage Type
New Conventional
Estimated Equity
$98,314
Purchase Details
Closed on
Aug 29, 2003
Sold by
Johnson Ken D
Bought by
Johnson T Mark
Purchase Details
Closed on
Dec 24, 1998
Sold by
Johnson Ken D and Johnson Laur
Bought by
Johnson Ken D
Purchase Details
Closed on
Feb 12, 1997
Bought by
Johnson Ken D and Johnson Laur
Create a Home Valuation Report for This Property
The Home Valuation Report is an in-depth analysis detailing your home's value as well as a comparison with similar homes in the area
Home Values in the Area
Average Home Value in this Area
Purchase History
| Date | Buyer | Sale Price | Title Company |
|---|---|---|---|
| Young Aletha Dawn | $95,000 | -- | |
| Gth Equity Llc | -- | -- | |
| Johnson T Mark | $37,000 | -- | |
| Johnson Ken D | -- | -- | |
| Johnson Ken D | -- | -- |
Source: Public Records
Mortgage History
| Date | Status | Borrower | Loan Amount |
|---|---|---|---|
| Open | Young Aletha Dawn | $95,959 |
Source: Public Records
Tax History Compared to Growth
Tax History
| Year | Tax Paid | Tax Assessment Tax Assessment Total Assessment is a certain percentage of the fair market value that is determined by local assessors to be the total taxable value of land and additions on the property. | Land | Improvement |
|---|---|---|---|---|
| 2024 | $1,357 | $65,764 | $6,900 | $58,864 |
| 2023 | $766 | $59,319 | $5,520 | $53,799 |
| 2022 | $1,156 | $51,961 | $5,520 | $46,441 |
| 2021 | $1,053 | $43,011 | $4,800 | $38,211 |
| 2020 | $1,021 | $40,650 | $4,800 | $35,850 |
| 2019 | $1,025 | $40,396 | $4,800 | $35,596 |
| 2018 | $1,017 | $39,268 | $4,800 | $34,468 |
| 2017 | $1,020 | $38,770 | $4,800 | $33,970 |
| 2016 | $995 | $37,533 | $4,800 | $32,733 |
| 2015 | $945 | $35,104 | $4,800 | $30,304 |
| 2014 | $931 | $34,433 | $4,800 | $29,633 |
| 2013 | -- | $34,432 | $4,800 | $29,632 |
Source: Public Records
Map
Nearby Homes
- 2860 Stringer Rd
- 00 57 Acres Off Stringer Rd Off Metcalf-Beachton Rd
- 304 Bellingham Dr
- 7500 U S 19
- 131 Pheasant Ridge
- 104 Stratford Way
- 6908 Metcalf Rd
- 333 Shallowbrook Farms Rd
- 113 Harrogate Ln
- 396 Meander Trace
- 00 Harrogate Ln
- 122 Avalon Way
- Lot 25 A Avalon Way Unit 25-A
- 10087 Springhill Rd
- 10119 Springhill Rd
- 401 Habersham Rd
- 9700 Old Magnolia Rd
- 420 Woodlands Blvd
- 109 Elijah Hill Ln
- 115 Elijah Hill Ln
- 3059 Broad St
- 3030 Broad St
- 1014 S John St
- 1076 N Louis St
- 3049 Hancock St
- 2089 Broad St
- 1058 N John St
- 1019 Manning St
- 1048 S John St
- 3018 N Louis St
- 1057 Manning St
- 2057 Broad St
- 2200 Hancock St
- 000 Broad St
- 2100 Hancock St
- 1105 N Louis St
- 1036 Manning St
- 2021 Hancock St
- 2048 Hancock St
- 1072 Stegall St