Estimated Value: $666,000 - $711,948
3
Beds
3
Baths
1,400
Sq Ft
$488/Sq Ft
Est. Value
About This Home
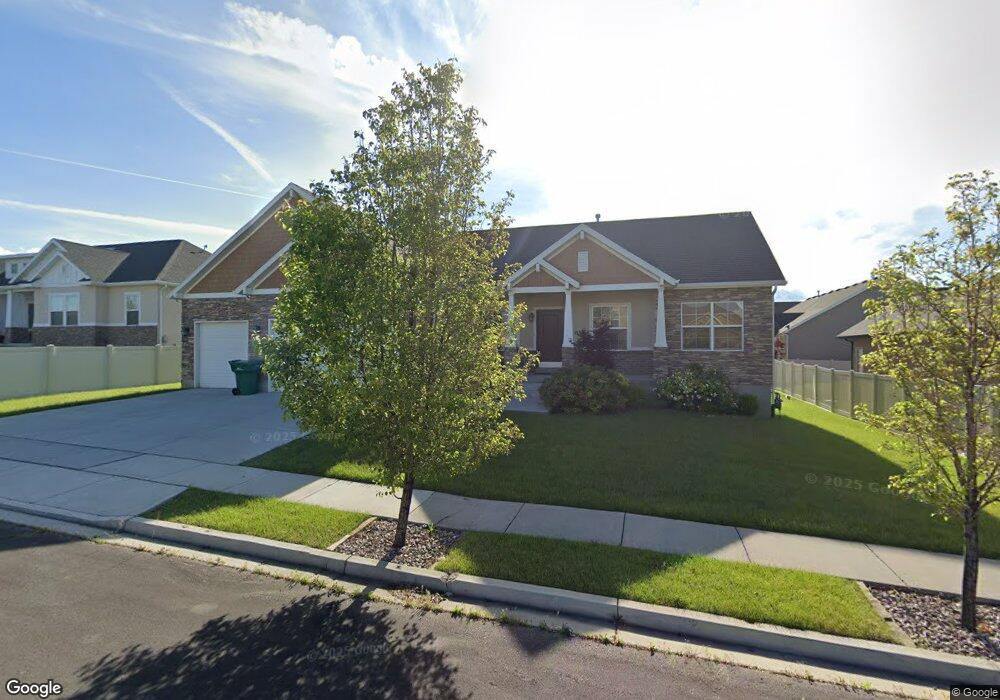
This home is located at 3058 N 1120 W Unit 36, Lehi, UT 84043 and is currently estimated at $683,737, approximately $488 per square foot. 3058 N 1120 W Unit 36 is a home located in Utah County with nearby schools including Fox Hollow Elementary School, Skyridge High School, and Ignite Entrepreneurship Academy.
Ownership History
Date
Name
Owned For
Owner Type
Purchase Details
Closed on
Mar 18, 2021
Sold by
Owens Derek
Bought by
Owens Derek and Owens Hilary
Current Estimated Value
Home Financials for this Owner
Home Financials are based on the most recent Mortgage that was taken out on this home.
Original Mortgage
$460,750
Outstanding Balance
$413,030
Interest Rate
2.7%
Mortgage Type
New Conventional
Estimated Equity
$270,707
Purchase Details
Closed on
Mar 17, 2021
Sold by
Kleiwer Curtis M
Bought by
Owens Derek
Home Financials for this Owner
Home Financials are based on the most recent Mortgage that was taken out on this home.
Original Mortgage
$460,750
Outstanding Balance
$413,030
Interest Rate
2.7%
Mortgage Type
New Conventional
Estimated Equity
$270,707
Purchase Details
Closed on
Aug 21, 2012
Sold by
Rochelle Investments Lc
Bought by
Kliewer Curtis M
Home Financials for this Owner
Home Financials are based on the most recent Mortgage that was taken out on this home.
Original Mortgage
$255,290
Interest Rate
3.25%
Mortgage Type
FHA
Create a Home Valuation Report for This Property
The Home Valuation Report is an in-depth analysis detailing your home's value as well as a comparison with similar homes in the area
Home Values in the Area
Average Home Value in this Area
Purchase History
| Date | Buyer | Sale Price | Title Company |
|---|---|---|---|
| Owens Derek | -- | Real Advantage Title Insuran | |
| Owens Derek | -- | Real Advantage Ttl Ins Agcy | |
| Kliewer Curtis M | -- | Metro National Title |
Source: Public Records
Mortgage History
| Date | Status | Borrower | Loan Amount |
|---|---|---|---|
| Open | Owens Derek | $460,750 | |
| Closed | Kliewer Curtis M | $255,290 |
Source: Public Records
Tax History Compared to Growth
Tax History
| Year | Tax Paid | Tax Assessment Tax Assessment Total Assessment is a certain percentage of the fair market value that is determined by local assessors to be the total taxable value of land and additions on the property. | Land | Improvement |
|---|---|---|---|---|
| 2025 | $2,910 | $374,660 | $320,300 | $360,900 |
| 2024 | $2,910 | $340,505 | $0 | $0 |
| 2023 | $2,691 | $341,935 | $0 | $0 |
| 2022 | $2,850 | $351,010 | $0 | $0 |
| 2021 | $2,422 | $451,000 | $185,300 | $265,700 |
| 2020 | $2,281 | $419,900 | $171,600 | $248,300 |
| 2019 | $2,130 | $407,700 | $171,600 | $236,100 |
| 2018 | $2,146 | $388,300 | $169,400 | $218,900 |
| 2017 | $1,938 | $186,395 | $0 | $0 |
| 2016 | $1,898 | $169,400 | $0 | $0 |
| 2015 | $1,937 | $164,065 | $0 | $0 |
| 2014 | $1,859 | $156,530 | $0 | $0 |
Source: Public Records
Map
Nearby Homes
- 1155 W 2980 N
- 2946 N 1080 W
- 1167 W 2980 N
- 1179 W 2980 N
- Rhapsody Plan at Lehi Terrace
- Gallivan Plan at Lehi Terrace
- Concerto Plan at Lehi Terrace
- Grand Plan at Lehi Terrace
- Arietta Plan at Lehi Terrace
- Libby Plan at Lehi Terrace
- Rose Plan at Lehi Terrace
- Capitol Plan at Lehi Terrace
- Metro Plan at Lehi Terrace
- Cantata Plan at Lehi Terrace
- Vieve Plan at Lehi Terrace
- Kilby Plan at Lehi Terrace
- 3080 N 1200 W
- 3130 N Provence Ln Unit K2
- 2687 N 900 W
- 804 W 2700 N
- 3058 N 1120 W
- 3032 N 1120 W
- 1088 W 3020 N
- 3074 N 1120 W Unit 3
- 3074 N 1120 W
- 3053 N 1120 W Unit 38
- 3053 N 1120 W Unit 37
- 3053 N 1120 W
- 1073 W 3100 N Unit 4
- 1072 W 3020 N
- 1072 W 3020 N Unit 33
- 3029 N 1120 W Unit 38
- 3029 N 1120 W
- 3079 N 1120 W
- 1054 W 3020 N
- 1054 W 3020 N Unit 32
- 1098 W 3100 N Unit 10
- 1065 W 3020 N
- 3055 N 1200 W
- 3111 N 1050 W