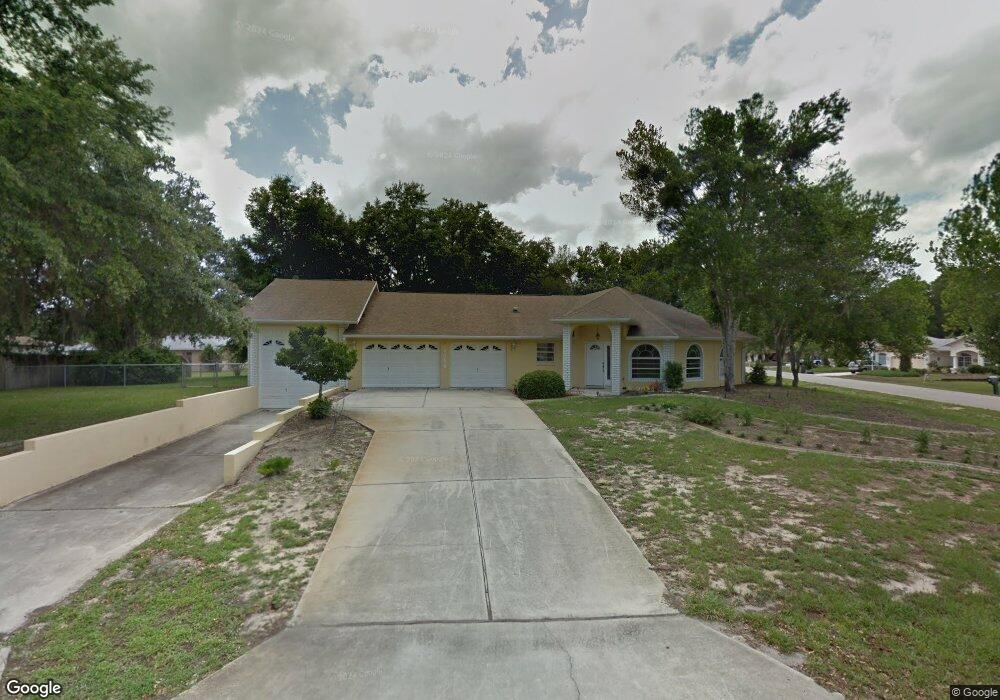
3058 S Tellico Terrace Inverness, FL 34450
Estimated Value: $330,000 - $443,000
3
Beds
3
Baths
2,180
Sq Ft
$169/Sq Ft
Est. Value
About This Home
This home is located at 3058 S Tellico Terrace, Inverness, FL 34450 and is currently estimated at $367,355, approximately $168 per square foot. 3058 S Tellico Terrace is a home located in Citrus County with nearby schools including Inverness Primary School, Inverness Middle School, and Citrus High School.
Ownership History
Date
Name
Owned For
Owner Type
Purchase Details
Closed on
Dec 21, 2010
Sold by
Downing Raymond E and Downing Betty Jo
Bought by
Carlton James W and Carlton Barbara Gail
Current Estimated Value
Purchase Details
Closed on
Nov 4, 2010
Sold by
Grumbling Patricia Ann and Cacv Of Colorado Llc
Bought by
Downing Raymond E and Downing Betty Jo
Purchase Details
Closed on
Nov 1, 2010
Bought by
Carlton James W and Carlton Barbara Gail
Purchase Details
Closed on
Sep 23, 2004
Sold by
Downing Raymond E and Downing Betty Jo
Bought by
Grambling Patricia Ann
Home Financials for this Owner
Home Financials are based on the most recent Mortgage that was taken out on this home.
Original Mortgage
$185,000
Interest Rate
6%
Mortgage Type
Seller Take Back
Purchase Details
Closed on
Dec 1, 1993
Bought by
Carlton James W and Carlton Barbara Gail
Purchase Details
Closed on
Aug 1, 1989
Bought by
Carlton James W and Carlton Barbara Gail
Create a Home Valuation Report for This Property
The Home Valuation Report is an in-depth analysis detailing your home's value as well as a comparison with similar homes in the area
Home Values in the Area
Average Home Value in this Area
Purchase History
| Date | Buyer | Sale Price | Title Company |
|---|---|---|---|
| Carlton James W | -- | None Available | |
| Downing Raymond E | -- | Attorney | |
| Downing Raymond E | -- | Attorney | |
| Carlton James W | $100 | -- | |
| Grambling Patricia Ann | $205,000 | Fidelity Title Services Llc | |
| Carlton James W | $12,000 | -- | |
| Carlton James W | $100 | -- |
Source: Public Records
Mortgage History
| Date | Status | Borrower | Loan Amount |
|---|---|---|---|
| Previous Owner | Grambling Patricia Ann | $185,000 |
Source: Public Records
Tax History Compared to Growth
Tax History
| Year | Tax Paid | Tax Assessment Tax Assessment Total Assessment is a certain percentage of the fair market value that is determined by local assessors to be the total taxable value of land and additions on the property. | Land | Improvement |
|---|---|---|---|---|
| 2024 | $1,504 | $134,268 | -- | -- |
| 2023 | $1,504 | $130,357 | $0 | $0 |
| 2022 | $1,407 | $126,560 | $0 | $0 |
| 2021 | $1,350 | $122,874 | $0 | $0 |
| 2020 | $1,287 | $176,785 | $10,710 | $166,075 |
| 2019 | $1,266 | $165,250 | $10,710 | $154,540 |
| 2018 | $1,237 | $154,440 | $10,710 | $143,730 |
| 2017 | $1,228 | $113,854 | $10,710 | $103,144 |
| 2016 | $1,206 | $109,504 | $10,710 | $98,794 |
| 2015 | $1,220 | $108,743 | $10,710 | $98,033 |
| 2014 | $1,242 | $107,880 | $10,514 | $97,366 |
Source: Public Records
Map
Nearby Homes
- 3061 S Franklin Terrace
- 9082 E Coker Creek Ln
- 3111 S Blackmountain Dr
- 8711 E Cresco Ln
- 8831 E Sandpiper Dr
- 3499 S Stroud Terrace
- 9293 E Windwood Loop
- 3231 S Eagle Point
- 2457 S Summerwood Point
- 8725 E Rosemont Ct
- 2435 S Summerwood Point
- 2908 S Skyline Dr
- 9495 E Baymeadows Dr
- 8505 E Sandpiper Dr
- 9515 E Baymeadows Dr
- 9467 E Baymeadows Dr
- 9546 E Baymeadows Dr
- 2550 S Bali Point
- 8301 E Fairway Loop
- 9520 E Baymeadows Dr
- 3045 S Franklin Terrace
- 3092 S Tellico Terrace
- 3077 S Franklin Terrace
- 9027 E Cashiers Ct
- 9060 E Cashiers Ct
- 9055 E Cashiers Ct
- 3081 S Tellico Terrace
- 9015 E Cashiers Ct
- 9067 E Cashiers Ct
- 3095 S Tellico Terrace
- 3048 S Franklin Terrace
- 3108 S Tellico Terrace
- 3062 S Franklin Terrace
- 3091 S Franklin Terrace
- 3078 S Franklin Terrace
- 3034 S Franklin Terrace
- 9001 E Cashiers Ct
- 9081 E Cashiers Ct Unit 12
- 9081 E Cashiers Ct