Estimated Value: $559,000 - $611,000
3
Beds
3
Baths
2,362
Sq Ft
$246/Sq Ft
Est. Value
About This Home
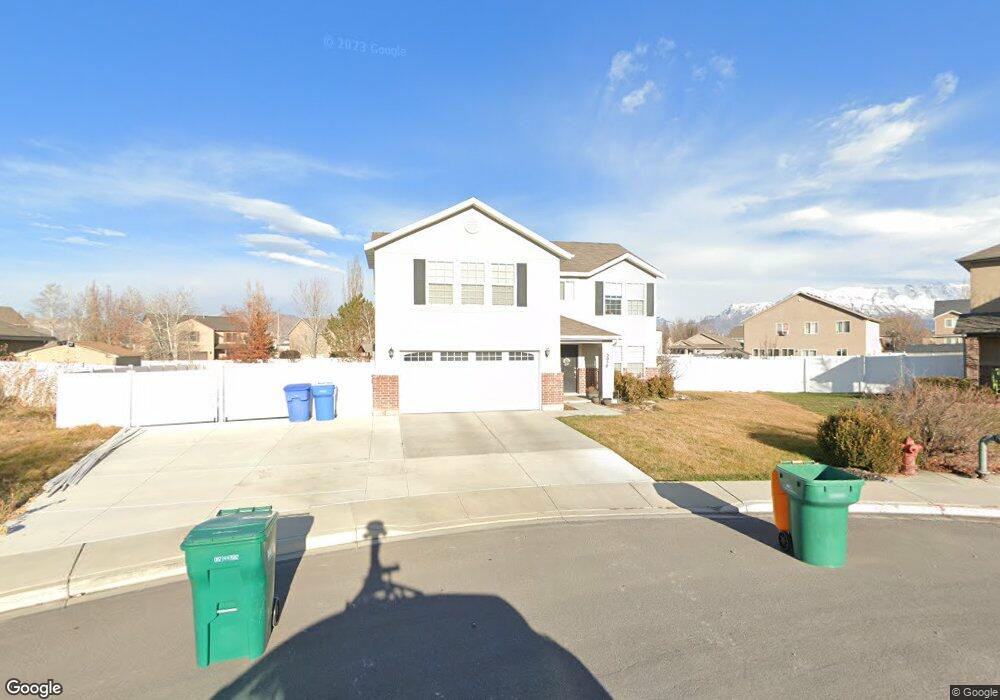
This home is located at 3058 W Willow Pod, Lehi, UT 84043 and is currently estimated at $581,289, approximately $246 per square foot. 3058 W Willow Pod is a home located in Utah County with nearby schools including Snow Springs Elementary, Willowcreek Middle School, and Lehi High School.
Ownership History
Date
Name
Owned For
Owner Type
Purchase Details
Closed on
Jun 27, 2013
Sold by
Louw Keith and Louw Amber
Bought by
Mince Cory D
Current Estimated Value
Home Financials for this Owner
Home Financials are based on the most recent Mortgage that was taken out on this home.
Original Mortgage
$240,900
Outstanding Balance
$171,867
Interest Rate
3.48%
Mortgage Type
VA
Estimated Equity
$409,422
Purchase Details
Closed on
Oct 13, 2009
Sold by
Probasco Ryan W and Probasco Liesl A
Bought by
Louw Keith and Louw Amber
Home Financials for this Owner
Home Financials are based on the most recent Mortgage that was taken out on this home.
Original Mortgage
$201,286
Interest Rate
5.05%
Mortgage Type
FHA
Purchase Details
Closed on
Jul 21, 2005
Sold by
Fieldstone Homes Utah Llc
Bought by
Probasco Ryan W and Probasco Liesl A
Home Financials for this Owner
Home Financials are based on the most recent Mortgage that was taken out on this home.
Original Mortgage
$148,992
Interest Rate
5.51%
Mortgage Type
Fannie Mae Freddie Mac
Create a Home Valuation Report for This Property
The Home Valuation Report is an in-depth analysis detailing your home's value as well as a comparison with similar homes in the area
Home Values in the Area
Average Home Value in this Area
Purchase History
| Date | Buyer | Sale Price | Title Company |
|---|---|---|---|
| Mince Cory D | -- | Meridian Title Co | |
| Louw Keith | -- | Utah First Title Insurance | |
| Probasco Ryan W | -- | Us Title Utah |
Source: Public Records
Mortgage History
| Date | Status | Borrower | Loan Amount |
|---|---|---|---|
| Open | Mince Cory D | $240,900 | |
| Previous Owner | Louw Keith | $201,286 | |
| Previous Owner | Probasco Ryan W | $148,992 |
Source: Public Records
Tax History Compared to Growth
Tax History
| Year | Tax Paid | Tax Assessment Tax Assessment Total Assessment is a certain percentage of the fair market value that is determined by local assessors to be the total taxable value of land and additions on the property. | Land | Improvement |
|---|---|---|---|---|
| 2025 | $2,349 | $287,155 | $213,700 | $308,400 |
| 2024 | $2,208 | $274,890 | $0 | $0 |
| 2023 | $871 | $280,610 | $0 | $0 |
| 2022 | $871 | $277,640 | $0 | $0 |
| 2021 | $2,007 | $373,800 | $123,700 | $250,100 |
| 2020 | $1,892 | $348,200 | $114,500 | $233,700 |
| 2019 | $1,704 | $326,000 | $114,500 | $211,500 |
| 2018 | $1,588 | $287,300 | $103,400 | $183,900 |
| 2017 | $1,542 | $148,280 | $0 | $0 |
| 2016 | $1,558 | $139,040 | $0 | $0 |
| 2015 | $1,537 | $130,240 | $0 | $0 |
| 2014 | $1,448 | $121,935 | $0 | $0 |
Source: Public Records
Map
Nearby Homes
- 2817 W Willow Dr
- 472 S Olive Place
- 410 S Olive Way
- The Roslyn Plan at Carla's Cove
- The Tracie Plan at Carla's Cove
- The Brooke Plan at Carla's Cove
- The Jackie Plan at Carla's Cove
- 105 N 2430 W
- 603 S 2500 W
- 122 N 2430 W Unit 1
- 653 S Willow Park Dr
- 1247 N Baycrest Dr
- 210 S Tamarak Cir
- 3590 W Grassland Dr
- 2812 S Greenhead Dr
- 1244 N Willowbrook
- 347 E Levengrove Dr Unit 1134
- 341 E Levengrove Dr Unit 1133
- 335 E Levengrove Dr Unit 1132
- 373 N Willow Haven Ave
- 3058 Willow Pod
- 3059 Willow Way
- 3052 Willow Pod
- 3052 W Willow Pod
- 3082 Willow Pod
- 3082 W Willow Pod
- 238 S Willow Reed
- 218 S Willow Reed
- 256 S Willow Reed
- 3057 W Willow Pod
- 3057 Willow Pod
- 3091 W Willow Pod
- 3091 Willow Pod
- 276 S Willow Reed
- 3079 W Willow Pod
- 3079 Willow Pod
- 3054 W Willow Way
- 3054 Willow Way
- 3068 Willow Way
- 3084 Willow Way