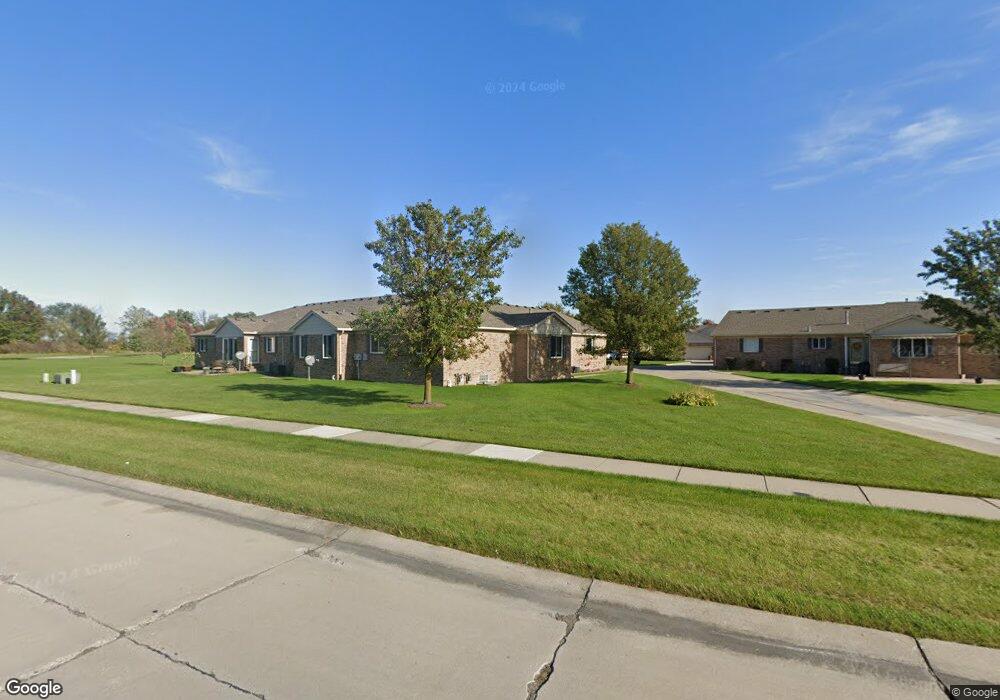
30587 Victoria Ct Unit 1 Chesterfield, MI 48051
Estimated Value: $242,164 - $278,000
2
Beds
2
Baths
1,350
Sq Ft
$197/Sq Ft
Est. Value
About This Home
This home is located at 30587 Victoria Ct Unit 1, Chesterfield, MI 48051 and is currently estimated at $266,041, approximately $197 per square foot. 30587 Victoria Ct Unit 1 is a home located in Macomb County with nearby schools including New Haven High School, Merritt Academy, and Austin Catholic Academy.
Ownership History
Date
Name
Owned For
Owner Type
Purchase Details
Closed on
Jan 21, 2022
Sold by
Ann Miller Jacqueline
Bought by
Miller Jacqueline Ann
Current Estimated Value
Purchase Details
Closed on
Jun 6, 2018
Sold by
Miller Jaqoeliue Ann and Miller Nicholas David
Bought by
Miller Jaqoeliue Ann
Purchase Details
Closed on
Sep 23, 2016
Sold by
Miller Jacqueline Ann
Bought by
Miller Jacqueline Ann and Miller Nicholas David
Purchase Details
Closed on
Oct 20, 2014
Sold by
Fannie Mae
Bought by
Miller Jacqueline A
Purchase Details
Closed on
Feb 27, 2014
Sold by
Green Tree Servicing Llc
Bought by
Fannie Mae and Federal National Mortgage Association
Purchase Details
Closed on
Feb 21, 2014
Sold by
Bryant Michael R and Bryant Cheryl M
Bought by
Gree Tree Servicing Llc
Purchase Details
Closed on
Dec 6, 2002
Sold by
Concord Development Co L
Bought by
Bryant Michael R
Create a Home Valuation Report for This Property
The Home Valuation Report is an in-depth analysis detailing your home's value as well as a comparison with similar homes in the area
Home Values in the Area
Average Home Value in this Area
Purchase History
| Date | Buyer | Sale Price | Title Company |
|---|---|---|---|
| Miller Jacqueline Ann | -- | None Listed On Document | |
| Miller Jaqoeliue Ann | -- | None Available | |
| Miller Jacqueline Ann | -- | None Available | |
| Miller Jacqueline A | $134,000 | None Available | |
| Fannie Mae | -- | None Available | |
| Gree Tree Servicing Llc | $120,241 | None Available | |
| Bryant Michael R | $144,000 | -- |
Source: Public Records
Mortgage History
| Date | Status | Borrower | Loan Amount |
|---|---|---|---|
| Closed | Bryant Michael R | -- |
Source: Public Records
Tax History Compared to Growth
Tax History
| Year | Tax Paid | Tax Assessment Tax Assessment Total Assessment is a certain percentage of the fair market value that is determined by local assessors to be the total taxable value of land and additions on the property. | Land | Improvement |
|---|---|---|---|---|
| 2025 | $2,939 | $113,700 | $0 | $0 |
| 2024 | $1,703 | $112,400 | $0 | $0 |
| 2023 | $1,614 | $103,300 | $0 | $0 |
| 2022 | $2,659 | $92,500 | $0 | $0 |
| 2021 | $2,586 | $91,500 | $0 | $0 |
| 2020 | $1,484 | $90,000 | $0 | $0 |
| 2019 | $2,387 | $85,600 | $0 | $0 |
| 2018 | $2,258 | $81,500 | $10,000 | $71,500 |
| 2017 | $2,232 | $73,250 | $10,000 | $63,250 |
| 2016 | $2,228 | $73,250 | $0 | $0 |
| 2015 | $711 | $66,450 | $0 | $0 |
| 2014 | $711 | $52,800 | $5,250 | $47,550 |
| 2012 | -- | $0 | $0 | $0 |
Source: Public Records
Map
Nearby Homes
- 30601 Victoria Ct
- 30600 Victoria Ct
- 30608 Eleanor Ct Unit 72
- 30596 Sabrina Ct
- 00 Gratiot Ave
- 27350 25 Mile Rd
- Vacant Land 26 Mile Rd
- 30060 Hickey Rd
- 30030 Hickey Rd
- 53990 N Foster Rd
- 28937 26 Mile Rd
- 53929 Bates Rd
- 53841 Bates Rd
- 53659 Bates Rd
- 53615 Bates Rd
- 53737 Bates Rd
- 53534 Spurry Ln
- 53925 Andrew Dr
- 53754 Traditional Dr Unit 66
- 29280 Classic Dr Unit 115
- 30591 Victoria Ct
- 30593 Victoria Ct Unit 1 4
- 30587 Victoria Ct
- 30589 Victoria Ct Unit 2
- 30593 Victoria Ct Unit 4
- 30589 Victoria Ct
- 30593 Victoria Ct
- 30589 Victoria Ct Unit 1
- 30597 Victoria Ct
- 30599 Victoria Ct
- 30599 Victoria Ct Unit 7
- 30595 Victoria Ct
- 30586 Victoria Ct
- 30588 Victoria Ct
- 30598 Victoria Ct
- 30594 Victoria Ct
- 30598 Victoria Ct Unit 10
- 30594 Victoria Ct Unit 12
- 30575 Angela Marie Ct Unit 1
- 30579 Angela Marie Ct