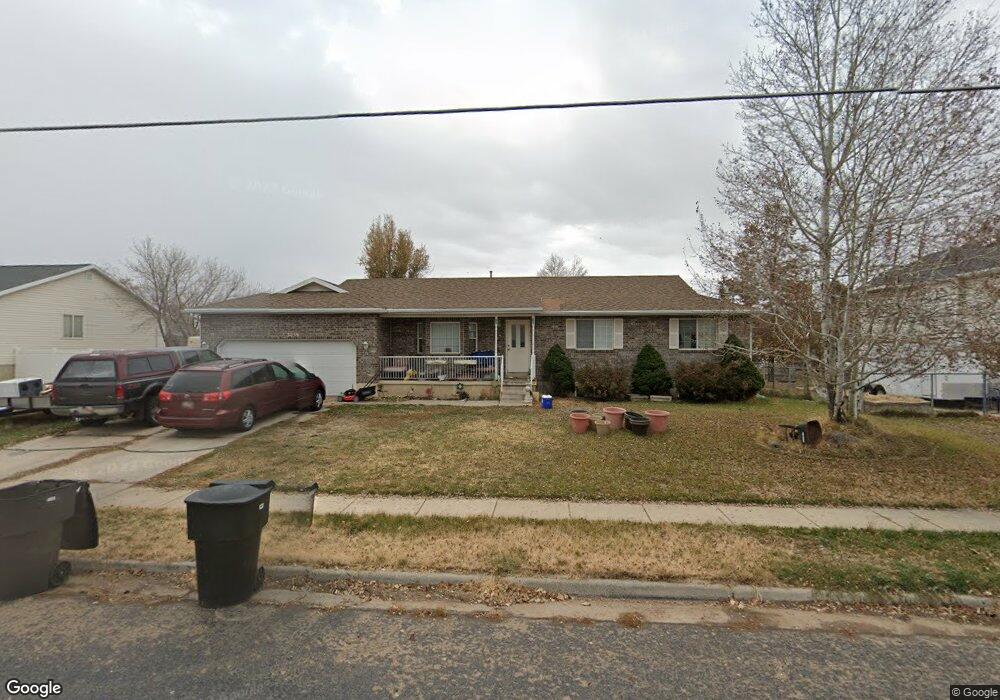
3059 W 1300 N Clearfield, UT 84015
Estimated Value: $480,352 - $525,000
3
Beds
3
Baths
3,102
Sq Ft
$163/Sq Ft
Est. Value
About This Home
This home is located at 3059 W 1300 N, Clearfield, UT 84015 and is currently estimated at $505,588, approximately $162 per square foot. 3059 W 1300 N is a home located in Davis County with nearby schools including Lakeside School, West Point Junior High School, and Syracuse High School.
Ownership History
Date
Name
Owned For
Owner Type
Purchase Details
Closed on
Jun 19, 2003
Sold by
Lasalle Bank Na
Bought by
Henstrom Steven A
Current Estimated Value
Home Financials for this Owner
Home Financials are based on the most recent Mortgage that was taken out on this home.
Original Mortgage
$147,584
Outstanding Balance
$62,722
Interest Rate
5.37%
Mortgage Type
FHA
Estimated Equity
$442,866
Purchase Details
Closed on
Aug 4, 1998
Sold by
Stacy Rex O and Willhite Jed B
Bought by
Prieto Rudy J and Prieto Lesa
Home Financials for this Owner
Home Financials are based on the most recent Mortgage that was taken out on this home.
Original Mortgage
$136,000
Interest Rate
12.75%
Purchase Details
Closed on
May 10, 1996
Sold by
New Hampton Manor Associates
Bought by
Stacy Rex O and Willhite Jed B
Create a Home Valuation Report for This Property
The Home Valuation Report is an in-depth analysis detailing your home's value as well as a comparison with similar homes in the area
Home Values in the Area
Average Home Value in this Area
Purchase History
| Date | Buyer | Sale Price | Title Company |
|---|---|---|---|
| Henstrom Steven A | -- | First American Title Co | |
| Prieto Rudy J | -- | Avis & Archibald Title Ins | |
| Stacy Rex O | -- | Security Title Company |
Source: Public Records
Mortgage History
| Date | Status | Borrower | Loan Amount |
|---|---|---|---|
| Open | Henstrom Steven A | $147,584 | |
| Previous Owner | Prieto Rudy J | $136,000 | |
| Closed | Prieto Rudy J | $12,281 | |
| Closed | Henstrom Steven A | $3,000 |
Source: Public Records
Tax History
| Year | Tax Paid | Tax Assessment Tax Assessment Total Assessment is a certain percentage of the fair market value that is determined by local assessors to be the total taxable value of land and additions on the property. | Land | Improvement |
|---|---|---|---|---|
| 2025 | $2,841 | $266,200 | $91,651 | $174,549 |
| 2024 | $2,676 | $251,901 | $91,735 | $160,166 |
| 2023 | $2,489 | $431,000 | $111,129 | $319,871 |
| 2022 | $2,681 | $254,100 | $56,928 | $197,172 |
| 2021 | $2,433 | $345,000 | $92,388 | $252,612 |
| 2020 | $2,130 | $298,000 | $76,978 | $221,022 |
| 2019 | $2,051 | $283,000 | $74,872 | $208,128 |
| 2018 | $1,868 | $254,000 | $76,283 | $177,717 |
| 2016 | $1,685 | $120,560 | $29,454 | $91,106 |
| 2015 | $1,606 | $108,900 | $29,454 | $79,446 |
| 2014 | $1,526 | $104,905 | $29,454 | $75,451 |
| 2013 | -- | $91,693 | $25,850 | $65,843 |
Source: Public Records
Map
Nearby Homes
- 2921 W 1300 N
- 3144 W 1050 N
- 3648 W 900 N Unit 207
- 3941 W 1800 N
- 1251 N 2525 W
- 1727 N 2700 W
- 2611 W 1675 N Unit 17
- 878 N 2600 W
- 2776 W 650 N
- 1509 N 2475 W
- 1398 N 2475 W
- 2544 W 1675 N
- 704 N 3500 W
- 3656 W 1800 N
- 1631 N 2340 W
- 2927 W 2100 N
- 1521 N 2275 W
- 2329 W 1680 N
- 2298 W 800 N
- 1881 N 2350 W Unit 110
Your Personal Tour Guide
Ask me questions while you tour the home.