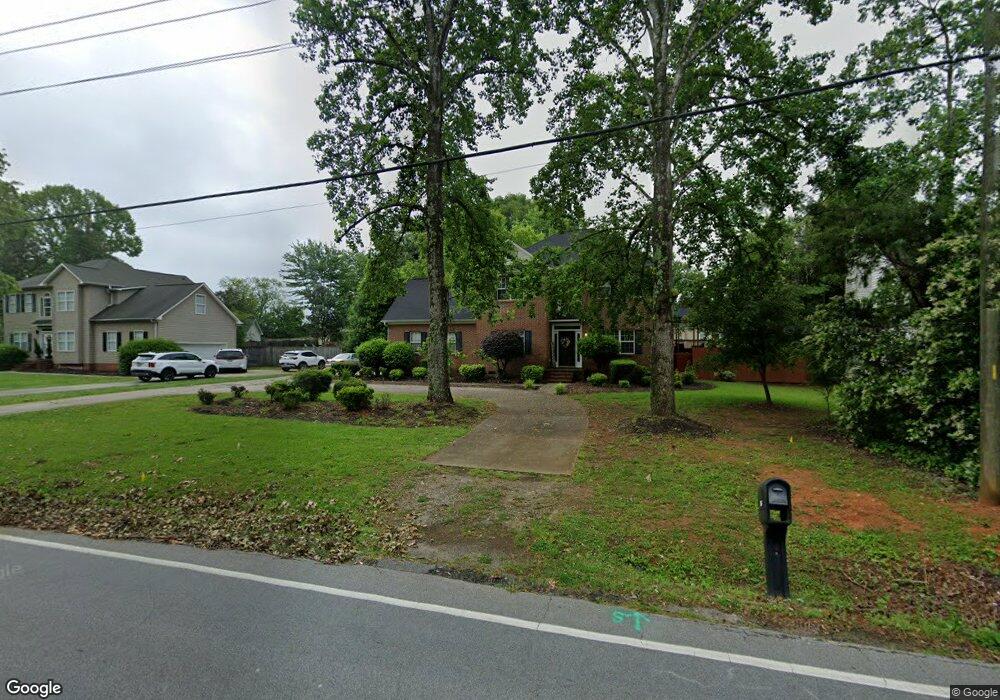
306 Adams Mill Rd Simpsonville, SC 29681
Estimated Value: $375,000 - $411,000
3
Beds
3
Baths
2,144
Sq Ft
$182/Sq Ft
Est. Value
About This Home
This home is located at 306 Adams Mill Rd, Simpsonville, SC 29681 and is currently estimated at $389,236, approximately $181 per square foot. 306 Adams Mill Rd is a home located in Greenville County with nearby schools including Bethel Elementary School, Hillcrest Middle School, and Mauldin High School.
Ownership History
Date
Name
Owned For
Owner Type
Purchase Details
Closed on
Jun 25, 2008
Sold by
General Funding Inc
Bought by
Kelley Lakisha H
Current Estimated Value
Home Financials for this Owner
Home Financials are based on the most recent Mortgage that was taken out on this home.
Original Mortgage
$146,812
Outstanding Balance
$94,183
Interest Rate
5.96%
Mortgage Type
VA
Estimated Equity
$295,053
Purchase Details
Closed on
Feb 5, 2007
Sold by
Wingard Jefferson C
Bought by
General Funding Inc
Purchase Details
Closed on
Mar 4, 2002
Sold by
General Funding Inc
Bought by
Wingard Jefferson C
Purchase Details
Closed on
Dec 28, 2001
Sold by
Master Simmons Charles B Jr For Dick Roy W
Bought by
General Funding Inc
Purchase Details
Closed on
Oct 5, 1999
Sold by
General Funding Inc
Bought by
Wong Dick R
Create a Home Valuation Report for This Property
The Home Valuation Report is an in-depth analysis detailing your home's value as well as a comparison with similar homes in the area
Home Values in the Area
Average Home Value in this Area
Purchase History
| Date | Buyer | Sale Price | Title Company |
|---|---|---|---|
| Kelley Lakisha H | $165,000 | -- | |
| General Funding Inc | -- | None Available | |
| Wingard Jefferson C | $165,000 | -- | |
| General Funding Inc | $140,845 | -- | |
| Wong Dick R | $135,000 | -- | |
| General Funding Inc | $20,000 | -- |
Source: Public Records
Mortgage History
| Date | Status | Borrower | Loan Amount |
|---|---|---|---|
| Open | Kelley Lakisha H | $146,812 |
Source: Public Records
Tax History Compared to Growth
Tax History
| Year | Tax Paid | Tax Assessment Tax Assessment Total Assessment is a certain percentage of the fair market value that is determined by local assessors to be the total taxable value of land and additions on the property. | Land | Improvement |
|---|---|---|---|---|
| 2024 | $1,488 | $9,420 | $1,800 | $7,620 |
| 2023 | $1,488 | $9,420 | $1,800 | $7,620 |
| 2022 | $1,450 | $9,420 | $1,800 | $7,620 |
| 2021 | $1,451 | $9,420 | $1,800 | $7,620 |
| 2020 | $1,329 | $8,190 | $1,360 | $6,830 |
| 2019 | $1,330 | $8,190 | $1,360 | $6,830 |
| 2018 | $1,382 | $8,190 | $1,360 | $6,830 |
| 2017 | $1,384 | $8,190 | $1,360 | $6,830 |
| 2016 | $3,649 | $204,770 | $33,990 | $170,780 |
| 2015 | $3,645 | $204,770 | $33,990 | $170,780 |
| 2014 | $3,069 | $178,085 | $35,486 | $142,599 |
Source: Public Records
Map
Nearby Homes
- 16 Paddock Run Ln
- 104 Gilden Ln
- 206 Sun Shower Way
- 409 Heather Falls Ln
- 341 Parkside Dr
- 120 Lavender Hill Ct Unit Site 6
- 204 Staffordshire Way
- 1 Gilder Trace
- 600 Daisy Hill Ln
- 213 Harts Ln
- 6 Mendenhall Ct
- 108 Brown Ln
- 202 Mornington Ct
- 5 Bathurst Ln
- 907 Highway 14
- 202 Plain Post Trail
- 102 Plain Post Trail
- 220 Plain Post Trail
- 106 Plain Post Trail
- 6 Digby Place
- 308 Adams Mill Rd
- 304 Adams Mill Rd
- 105 Chenoweth Dr
- 107 Chenoweth Dr
- 103 Chenoweth Dr
- 12 Chestnut Oaks Ct
- 109 Chenoweth Dr
- 100 Country Side Ln
- 101 Country Side Ln
- 101 Chenoweth Dr
- 8 Chestnut Oaks Ct
- 103 Carrington Way
- 105 Carrington Way
- 111 Chenoweth Dr
- 78 Chenoweth Dr
- 104 Chenoweth Dr
- 106 Chenoweth Dr
- 200 Chestnut Oaks Cir
- 102 Chenoweth Dr
- 202 Chestnut Oaks Cir