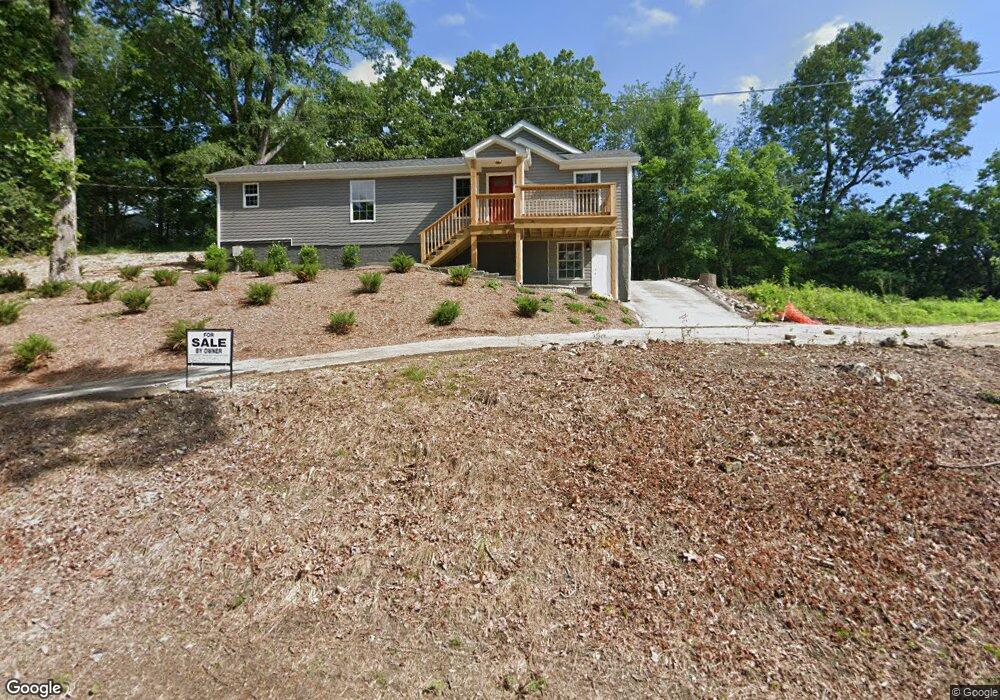
306 Alabama Ave Rossville, GA 30741
Estimated Value: $226,000 - $276,000
3
Beds
2
Baths
1,300
Sq Ft
$191/Sq Ft
Est. Value
About This Home
This home is located at 306 Alabama Ave, Rossville, GA 30741 and is currently estimated at $248,274, approximately $190 per square foot. 306 Alabama Ave is a home located in Walker County with nearby schools including Rossville Elementary School, Rossville Middle School, and Ridgeland High School.
Ownership History
Date
Name
Owned For
Owner Type
Purchase Details
Closed on
Jun 13, 2023
Sold by
Trotter Chris
Bought by
See Joseph Julian and See Ashley Victoria
Current Estimated Value
Home Financials for this Owner
Home Financials are based on the most recent Mortgage that was taken out on this home.
Original Mortgage
$8,225
Outstanding Balance
$7,427
Interest Rate
5.75%
Mortgage Type
New Conventional
Estimated Equity
$240,847
Purchase Details
Closed on
Sep 20, 2018
Sold by
Hammontree Eddie
Bought by
Trotter Chris
Purchase Details
Closed on
Mar 11, 2002
Sold by
Hammontree Eddie and Hammontree
Bought by
Hammontree Eddie and Hammontree Gloria
Purchase Details
Closed on
Apr 5, 1993
Sold by
Hammontree V H
Bought by
Hammontree Eddie and Hammontree
Purchase Details
Closed on
Sep 17, 1948
Bought by
Hammontree V H
Create a Home Valuation Report for This Property
The Home Valuation Report is an in-depth analysis detailing your home's value as well as a comparison with similar homes in the area
Home Values in the Area
Average Home Value in this Area
Purchase History
| Date | Buyer | Sale Price | Title Company |
|---|---|---|---|
| See Joseph Julian | $235,000 | -- | |
| Trotter Chris | $42,000 | -- | |
| Hammontree Eddie | $9,000 | -- | |
| Hammontree Eddie | -- | -- | |
| Hammontree V H | -- | -- |
Source: Public Records
Mortgage History
| Date | Status | Borrower | Loan Amount |
|---|---|---|---|
| Open | See Joseph Julian | $8,225 | |
| Open | See Joseph Julian | $230,743 |
Source: Public Records
Tax History Compared to Growth
Tax History
| Year | Tax Paid | Tax Assessment Tax Assessment Total Assessment is a certain percentage of the fair market value that is determined by local assessors to be the total taxable value of land and additions on the property. | Land | Improvement |
|---|---|---|---|---|
| 2024 | $1,748 | $78,950 | $6,564 | $72,386 |
| 2023 | $1,352 | $58,280 | $6,564 | $51,716 |
| 2022 | $822 | $31,496 | $4,011 | $27,485 |
| 2021 | $626 | $20,856 | $4,011 | $16,845 |
| 2020 | $590 | $18,724 | $4,011 | $14,713 |
| 2019 | $547 | $18,724 | $4,011 | $14,713 |
| 2018 | $610 | $23,049 | $4,011 | $19,038 |
| 2017 | $700 | $20,369 | $4,011 | $16,358 |
| 2016 | $485 | $14,491 | $4,011 | $10,480 |
| 2015 | $652 | $20,047 | $4,156 | $15,891 |
| 2014 | $571 | $20,047 | $4,156 | $15,891 |
| 2013 | -- | $20,047 | $4,156 | $15,891 |
Source: Public Records
Map
Nearby Homes
- 308 Alabama Ave
- 0 Alabama Ave
- 307 Tennessee Ave
- 305 Tennessee Ave
- 300 Alabama Ave
- 305 Alabama Ave
- 312 Alabama Ave
- 303 Tennessee Ave
- 309 Tennessee Ave
- 309 Tennessee Ave
- 301 Alabama Ave
- 301 Tennessee Ave
- 311 Alabama Ave
- 311 Tennessee Ave
- 311 Tennessee Ave
- 306 Tennessee Ave
- 915 Magnolia St
- 310 Tennessee Ave
- 317 Alabama Ave
- S S Oakwood St