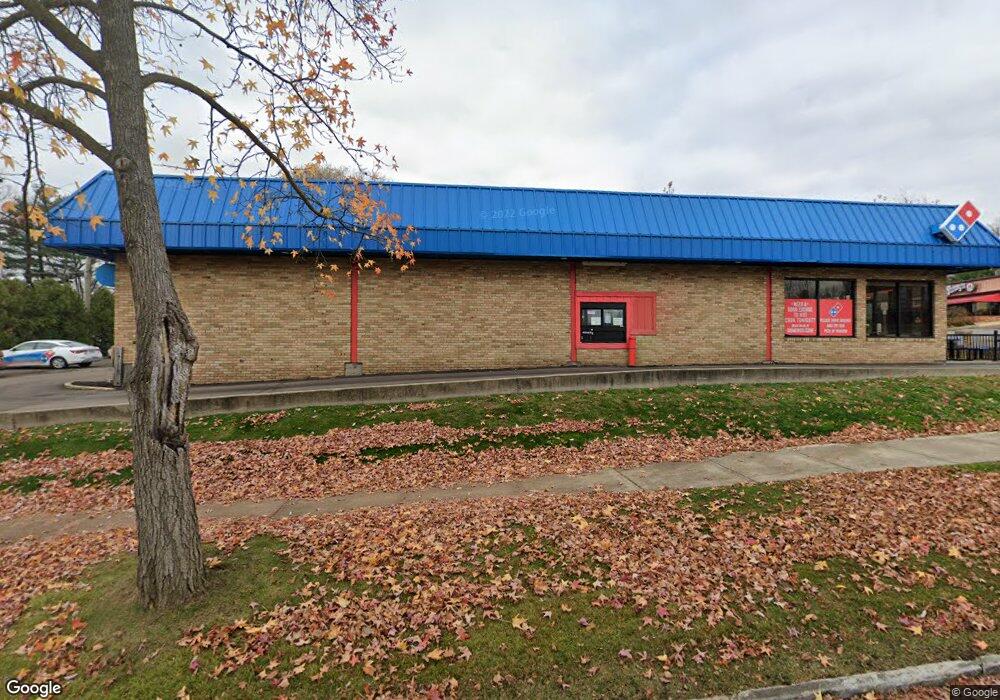
306 Beall Ave Wooster, OH 44691
Estimated Value: $1,035,264
Studio
--
Bath
2,880
Sq Ft
$359/Sq Ft
Est. Value
About This Home
This home is located at 306 Beall Ave, Wooster, OH 44691 and is currently estimated at $1,035,264, approximately $359 per square foot. 306 Beall Ave is a home located in Wayne County with nearby schools including Cornerstone Elementary School, Edgewood Middle School, and Wooster High School.
Ownership History
Date
Name
Owned For
Owner Type
Purchase Details
Closed on
Jun 18, 2008
Sold by
306 Beall Llc
Bought by
Tumalo Farms I Llc
Current Estimated Value
Purchase Details
Closed on
Oct 26, 2006
Sold by
Christiana Bank & Trust Company
Bought by
306 Beall Llc
Home Financials for this Owner
Home Financials are based on the most recent Mortgage that was taken out on this home.
Original Mortgage
$32,000
Interest Rate
6.47%
Mortgage Type
Future Advance Clause Open End Mortgage
Purchase Details
Closed on
Aug 25, 2004
Sold by
Bogner Donald P
Bought by
Christina Bank & Trust Co and Security National Assets Securitization
Purchase Details
Closed on
May 11, 1992
Sold by
Bogner Donald P and Bogner Kathlee
Bought by
Bogner Donald P and Bogner Kathlee
Purchase Details
Closed on
Feb 26, 1988
Bought by
Beall Avenue Development
Create a Home Valuation Report for This Property
The Home Valuation Report is an in-depth analysis detailing your home's value as well as a comparison with similar homes in the area
Home Values in the Area
Average Home Value in this Area
Purchase History
| Date | Buyer | Sale Price | Title Company |
|---|---|---|---|
| Tumalo Farms I Llc | $505,000 | Northstar Title Services Llc | |
| 306 Beall Llc | $210,000 | Northstar Title Services | |
| Christina Bank & Trust Co | $225,000 | -- | |
| Bogner Donald P | -- | -- | |
| Beall Avenue Development | -- | -- |
Source: Public Records
Mortgage History
| Date | Status | Borrower | Loan Amount |
|---|---|---|---|
| Previous Owner | 306 Beall Llc | $32,000 |
Source: Public Records
Tax History
| Year | Tax Paid | Tax Assessment Tax Assessment Total Assessment is a certain percentage of the fair market value that is determined by local assessors to be the total taxable value of land and additions on the property. | Land | Improvement |
|---|---|---|---|---|
| 2024 | $11,116 | $151,860 | $34,330 | $117,530 |
| 2023 | $11,109 | $151,860 | $34,330 | $117,530 |
| 2022 | $11,160 | $151,860 | $34,330 | $117,530 |
| 2021 | $11,287 | $151,860 | $34,330 | $117,530 |
| 2020 | $10,574 | $151,860 | $34,330 | $117,530 |
| 2019 | $10,980 | $145,910 | $27,970 | $117,940 |
| 2018 | $7,891 | $105,270 | $27,970 | $77,300 |
| 2017 | $7,870 | $105,270 | $27,970 | $77,300 |
| 2016 | $8,269 | $105,270 | $27,970 | $77,300 |
| 2015 | $8,133 | $105,270 | $27,970 | $77,300 |
| 2014 | $8,132 | $105,270 | $27,970 | $77,300 |
| 2013 | $10,556 | $138,960 | $34,970 | $103,990 |
Source: Public Records
Map
Nearby Homes
- 419 Nold Ave
- 331 Derr Ave
- 223 E Larwill St
- 423 N Market St
- 534 N Buckeye St
- 606 E Henry St
- 134 E Bowman St Unit 1/2
- 227 N Walnut St
- 230 Clark Ave
- 814 N Bever St
- 920 Washington St
- 938 Washington St
- 140 Ohio St
- 1117 Quinby Ave
- 851 Park Blvd
- 5 E Melrose Unit 5
- 758 Western Dr
- 801 & 803 Colony Ct
- 1575 Bellevue Dr
- 1552 Renwood Dr
- 248 Beall Ave
- 435 E Larwill St
- 426 E Larwill St
- 245 Beall Ave
- 425 E Larwill St
- 420 E Larwill St
- 232 Beall Ave
- 423 E Larwill St
- 344 Beall Ave
- 530 High St
- 427 Nold Ave
- 228 Beall Ave
- 416 E Larwill St
- 416 E Larwill St Unit Front Triplex Apt 1
- 416 E Larwill St Unit Rear Duplex Upper
- 433 Nold Ave
- 415 E Larwill St
- 408 E Larwill St
- 222 Beall Ave
- 404 E Larwill St
Your Personal Tour Guide
Ask me questions while you tour the home.