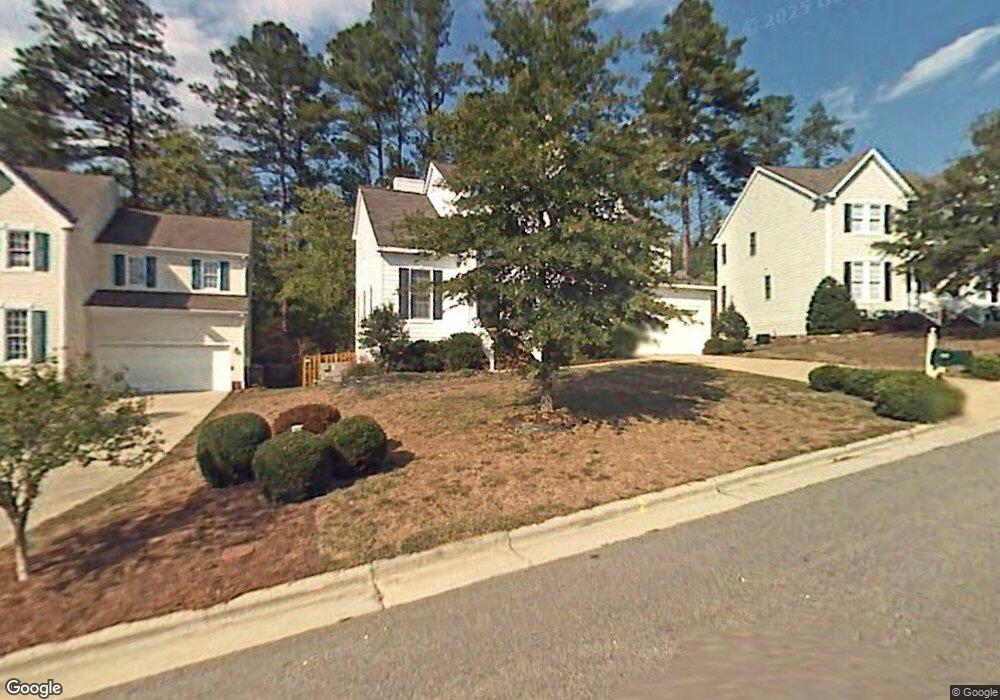
306 Castle Hayne Dr Cary, NC 27519
West Cary NeighborhoodEstimated Value: $521,000 - $545,075
3
Beds
3
Baths
1,753
Sq Ft
$305/Sq Ft
Est. Value
About This Home
This home is located at 306 Castle Hayne Dr, Cary, NC 27519 and is currently estimated at $534,769, approximately $305 per square foot. 306 Castle Hayne Dr is a home located in Wake County with nearby schools including Davis Drive Elementary, Davis Drive Middle, and Green Hope High.
Ownership History
Date
Name
Owned For
Owner Type
Purchase Details
Closed on
Jun 5, 2020
Sold by
Guerci Paul and Guerci Ellen
Bought by
Trimble Neil Hoke and Tyler Ashley S
Current Estimated Value
Home Financials for this Owner
Home Financials are based on the most recent Mortgage that was taken out on this home.
Original Mortgage
$260,900
Outstanding Balance
$231,699
Interest Rate
3.3%
Mortgage Type
New Conventional
Estimated Equity
$303,070
Purchase Details
Closed on
Jul 28, 2006
Sold by
Vincent David and Vincent Linda S
Bought by
Guerci Paul and Guerci Ellen
Purchase Details
Closed on
Oct 24, 2003
Sold by
Trimble Linda Sharleen and Vincent Linda S
Bought by
Vincent David and Vincent Linda S
Home Financials for this Owner
Home Financials are based on the most recent Mortgage that was taken out on this home.
Original Mortgage
$160,000
Interest Rate
6.03%
Mortgage Type
Purchase Money Mortgage
Purchase Details
Closed on
Jul 23, 1998
Sold by
Solaris Development Corp
Bought by
Trimble Linda Sharleen
Home Financials for this Owner
Home Financials are based on the most recent Mortgage that was taken out on this home.
Original Mortgage
$167,800
Interest Rate
6.75%
Create a Home Valuation Report for This Property
The Home Valuation Report is an in-depth analysis detailing your home's value as well as a comparison with similar homes in the area
Home Values in the Area
Average Home Value in this Area
Purchase History
| Date | Buyer | Sale Price | Title Company |
|---|---|---|---|
| Trimble Neil Hoke | $327,000 | None Available | |
| Guerci Paul | $215,000 | None Available | |
| Vincent David | -- | -- | |
| Trimble Linda Sharleen | $177,000 | -- |
Source: Public Records
Mortgage History
| Date | Status | Borrower | Loan Amount |
|---|---|---|---|
| Open | Trimble Neil Hoke | $260,900 | |
| Previous Owner | Vincent David | $160,000 | |
| Previous Owner | Trimble Linda Sharleen | $167,800 |
Source: Public Records
Tax History Compared to Growth
Tax History
| Year | Tax Paid | Tax Assessment Tax Assessment Total Assessment is a certain percentage of the fair market value that is determined by local assessors to be the total taxable value of land and additions on the property. | Land | Improvement |
|---|---|---|---|---|
| 2025 | $4,498 | $522,404 | $241,500 | $280,904 |
| 2024 | $4,400 | $522,404 | $241,500 | $280,904 |
| 2023 | $3,260 | $323,309 | $100,000 | $223,309 |
| 2022 | $3,138 | $323,309 | $100,000 | $223,309 |
| 2021 | $3,075 | $323,309 | $100,000 | $223,309 |
| 2020 | $3,091 | $323,309 | $100,000 | $223,309 |
| 2019 | $2,677 | $248,184 | $80,000 | $168,184 |
| 2018 | $0 | $248,184 | $80,000 | $168,184 |
| 2017 | $0 | $248,184 | $80,000 | $168,184 |
| 2016 | $2,379 | $248,184 | $80,000 | $168,184 |
| 2015 | -- | $231,880 | $62,000 | $169,880 |
| 2014 | -- | $231,880 | $62,000 | $169,880 |
Source: Public Records
Map
Nearby Homes
- 105 Point Harbor Dr
- 103 Town Creek Dr
- 145 Swan Quarter Dr
- 120 Union Mills Way
- 467 Methven Grove Dr
- 107 Morgans Corner
- 200 Carpenter Brook Dr
- 722 Mcrae Rd
- 100 Wentbridge Rd
- 320 Wedgemere St
- 324 Farrow Glen Loop
- 105 Swordgate Dr
- 203 Halls Mill Dr
- 104 Pellinore Ct
- 209 Parkmeadow Dr
- 106 Blue Boar Ct
- 410 Widdington Ln
- 124 Covington Square Dr
- 307 Sir Brennan Ct
- 205 Wedgemere St
- 304 Castle Hayne Dr
- 315 Castle Hayne Dr
- 308 Castle Hayne Dr
- 302 Castle Hayne Dr
- 310 Castle Hayne Dr
- 305 Castle Hayne Dr
- 307 Castle Hayne Dr Unit MPS Lot 23
- 307 Castle Hayne Dr
- 303 Castle Hayne Dr
- 312 Castle Hayne Dr
- 300 Castle Hayne Dr
- 309 Castle Hayne Dr
- 1058 Upchurch Farm Ln
- 301 Castle Hayne Dr
- 311 Castle Hayne Dr Unit MPS Lot 21
- 311 Castle Hayne Dr
- 1054 Upchurch Farm Ln
- 226 Castle Hayne Dr
- 314 Castle Hayne Dr
- 129 Point Harbor Dr