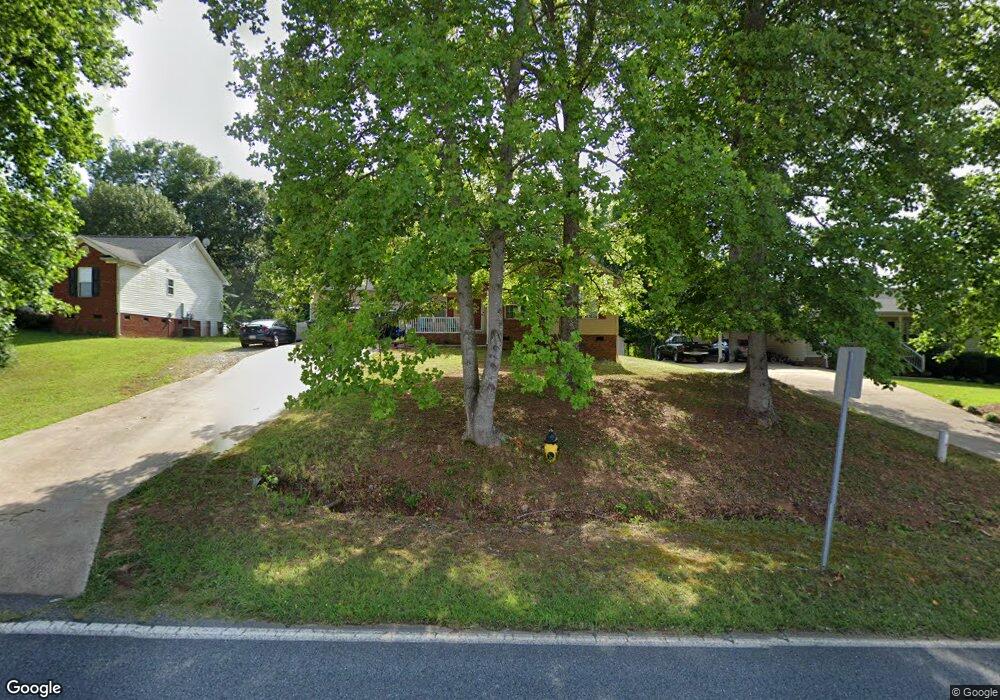
306 Crocker Rd Kings Mountain, NC 28086
Estimated Value: $199,054 - $262,000
--
Bed
--
Bath
1,132
Sq Ft
$216/Sq Ft
Est. Value
About This Home
This home is located at 306 Crocker Rd, Kings Mountain, NC 28086 and is currently estimated at $244,514, approximately $216 per square foot. 306 Crocker Rd is a home located in Cleveland County with nearby schools including Bethware Elementary School, Kings Mountain Middle, and Kings Mountain Intermediate School.
Ownership History
Date
Name
Owned For
Owner Type
Purchase Details
Closed on
Jun 16, 2023
Sold by
Boheler Emily M Ballard and Boheler James S
Bought by
Boheler Emily M Ballard
Current Estimated Value
Home Financials for this Owner
Home Financials are based on the most recent Mortgage that was taken out on this home.
Original Mortgage
$43,418
Outstanding Balance
$42,257
Interest Rate
6.39%
Mortgage Type
New Conventional
Estimated Equity
$202,257
Purchase Details
Closed on
Apr 20, 2009
Sold by
Good Raymond S and Good Judith E
Bought by
Good Raymond S and Goode Timothy
Purchase Details
Closed on
Apr 22, 2008
Sold by
Fleisher Jon E and Fleisher Tara S
Bought by
Ballard Emily M
Home Financials for this Owner
Home Financials are based on the most recent Mortgage that was taken out on this home.
Original Mortgage
$129,833
Interest Rate
6.08%
Mortgage Type
Purchase Money Mortgage
Create a Home Valuation Report for This Property
The Home Valuation Report is an in-depth analysis detailing your home's value as well as a comparison with similar homes in the area
Home Values in the Area
Average Home Value in this Area
Purchase History
| Date | Buyer | Sale Price | Title Company |
|---|---|---|---|
| Boheler Emily M Ballard | -- | None Listed On Document | |
| Good Raymond S | -- | None Available | |
| Ballard Emily M | $129,000 | None Available |
Source: Public Records
Mortgage History
| Date | Status | Borrower | Loan Amount |
|---|---|---|---|
| Open | Boheler Emily M Ballard | $43,418 | |
| Previous Owner | Ballard Emily M | $129,833 |
Source: Public Records
Tax History Compared to Growth
Tax History
| Year | Tax Paid | Tax Assessment Tax Assessment Total Assessment is a certain percentage of the fair market value that is determined by local assessors to be the total taxable value of land and additions on the property. | Land | Improvement |
|---|---|---|---|---|
| 2025 | $2,457 | $235,138 | $26,250 | $208,888 |
| 2024 | $1,415 | $117,088 | $18,750 | $98,338 |
| 2023 | $1,408 | $117,088 | $18,750 | $98,338 |
| 2022 | $1,350 | $117,088 | $18,750 | $98,338 |
| 2021 | $1,357 | $117,088 | $18,750 | $98,338 |
| 2020 | $1,206 | $101,212 | $18,750 | $82,462 |
| 2019 | $1,206 | $101,212 | $18,750 | $82,462 |
| 2018 | $1,185 | $101,212 | $18,750 | $82,462 |
| 2017 | $1,179 | $101,212 | $18,750 | $82,462 |
| 2016 | $1,183 | $101,212 | $18,750 | $82,462 |
| 2015 | $1,256 | $110,478 | $18,750 | $91,728 |
| 2014 | $1,256 | $110,478 | $18,750 | $91,728 |
Source: Public Records
Map
Nearby Homes
- 226 Caley St
- 223 Frank Burns Way
- 262 Frank Burns Way
- 180 Rosedale St
- 163 Kipling Ln
- 107 Frank Burns Way
- 106 Raintree Dr
- 129 Country Creek Dr
- 110 Kimberly Ln
- 202 Cameron Dr
- 125 Country Creek Dr
- 115 El Bethel Rd
- 106 Cameron Dr
- Plan 2338 at Cottages at Clovis Point
- Plan 2723 at Cottages at Clovis Point
- Plan 2539 at Cottages at Clovis Point
- Plan 1844 at Cottages at Clovis Point
- Plan 1445 at Cottages at Clovis Point
- Plan 1582 at Cottages at Clovis Point
- 231 Brinkley Dr
- 306 Crocker Rd
- 306 Crocker Rd Unit 19
- 304 Crocker Rd
- 308 Crocker Rd
- 310 Crocker Rd
- 565 Belcaro Dr
- 575 Belcaro Dr Unit 33
- 575 Belcaro Dr
- 557 Belcaro Dr
- 300 Crocker Rd
- 589 Belcaro Dr
- 113 Marcella Dr
- 539 Belcaro Dr
- 117 Marcella Dr
- 593 Belcaro Dr
- 111 Marcella Dr
- 119 Marcella Dr
- 233 Crocker Rd
- 314 Crocker Rd
- 250 Crocker Rd