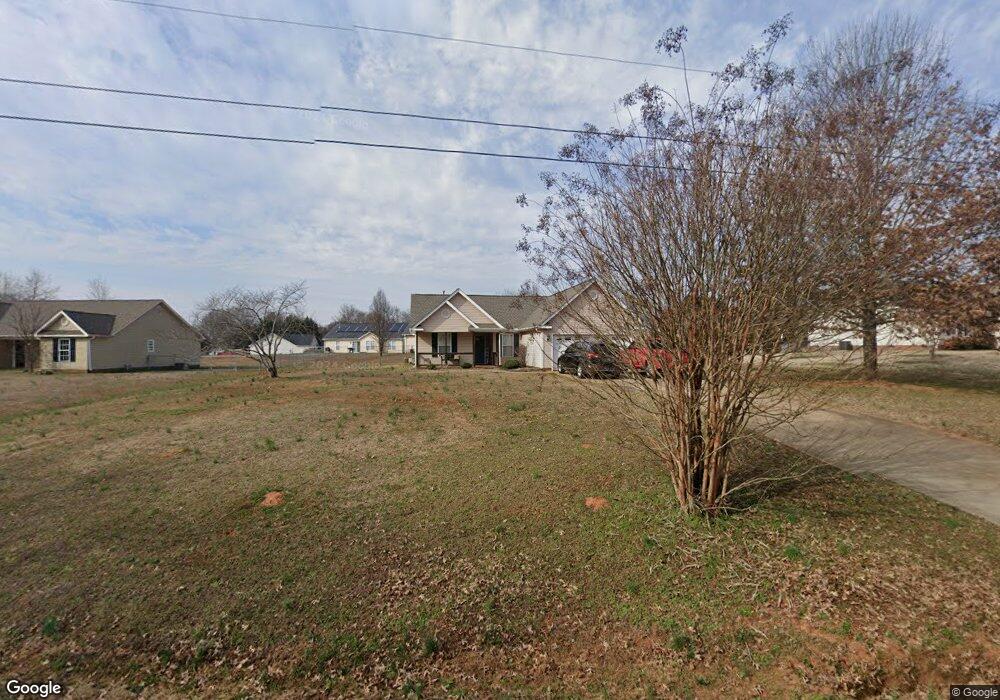
306 Cunningham Rd Woodruff, SC 29388
Estimated Value: $253,000 - $336,000
3
Beds
2
Baths
1,341
Sq Ft
$209/Sq Ft
Est. Value
About This Home
This home is located at 306 Cunningham Rd, Woodruff, SC 29388 and is currently estimated at $280,631, approximately $209 per square foot. 306 Cunningham Rd is a home located in Spartanburg County with nearby schools including Reidville Elementary School, Byrnes Freshman Academy, and James F. Byrnes High School.
Ownership History
Date
Name
Owned For
Owner Type
Purchase Details
Closed on
Jun 12, 2014
Sold by
Lawson Stacey and King Alisha
Bought by
Ensley Wanda S
Current Estimated Value
Home Financials for this Owner
Home Financials are based on the most recent Mortgage that was taken out on this home.
Original Mortgage
$113,898
Outstanding Balance
$87,152
Interest Rate
4.36%
Mortgage Type
FHA
Estimated Equity
$193,479
Purchase Details
Closed on
May 26, 2005
Sold by
Stonewood Homes Inc
Bought by
Sholes John Edward
Home Financials for this Owner
Home Financials are based on the most recent Mortgage that was taken out on this home.
Original Mortgage
$89,600
Interest Rate
4.87%
Mortgage Type
Adjustable Rate Mortgage/ARM
Purchase Details
Closed on
Jul 19, 2002
Sold by
Goforth Bonnie G
Bought by
Stonewood Homes Inc
Create a Home Valuation Report for This Property
The Home Valuation Report is an in-depth analysis detailing your home's value as well as a comparison with similar homes in the area
Home Values in the Area
Average Home Value in this Area
Purchase History
| Date | Buyer | Sale Price | Title Company |
|---|---|---|---|
| Ensley Wanda S | $116,000 | -- | |
| Sholes John Edward | $112,000 | -- | |
| Stonewood Homes Inc | $104,000 | Hanover Title Agency |
Source: Public Records
Mortgage History
| Date | Status | Borrower | Loan Amount |
|---|---|---|---|
| Open | Ensley Wanda S | $113,898 | |
| Previous Owner | Sholes John Edward | $16,800 | |
| Previous Owner | Sholes John Edward | $89,600 |
Source: Public Records
Tax History
| Year | Tax Paid | Tax Assessment Tax Assessment Total Assessment is a certain percentage of the fair market value that is determined by local assessors to be the total taxable value of land and additions on the property. | Land | Improvement |
|---|---|---|---|---|
| 2025 | $920 | $6,120 | $585 | $5,535 |
| 2024 | $920 | $6,120 | $585 | $5,535 |
| 2023 | $920 | $6,120 | $585 | $5,535 |
| 2022 | $829 | $5,322 | $482 | $4,840 |
| 2021 | $829 | $5,322 | $482 | $4,840 |
| 2020 | $811 | $5,322 | $482 | $4,840 |
| 2019 | $811 | $5,322 | $482 | $4,840 |
| 2018 | $784 | $5,322 | $482 | $4,840 |
| 2017 | $668 | $4,628 | $408 | $4,220 |
| 2016 | $643 | $4,628 | $408 | $4,220 |
| 2015 | $632 | $6,606 | $612 | $5,994 |
| 2014 | $596 | $4,404 | $408 | $3,996 |
Source: Public Records
Map
Nearby Homes
- 1837 Pennine Dr
- 126 Mossend St
- 123 Mossend St
- 122 Mossend St
- 119 Mossend St
- 501 Fenwick Dr
- 118 Mossend St
- 513 Fenwick Dr
- 462 Fenwick Dr
- 454 Fenwick Dr
- 452 Fenwick Dr
- 1515 Talley Ridge Dr
- 305 Addie Ct
- 420 Lightwood Farm Rd
- 308 Addie Ct
- 3342 Cypress Hollow Dr
- 3346 Cypress Hollow Dr
- 3350 Cypress Hollow Dr
- 3334 Cypress Hollow Dr
- 3354 Cypress Hollow Dr
Your Personal Tour Guide
Ask me questions while you tour the home.