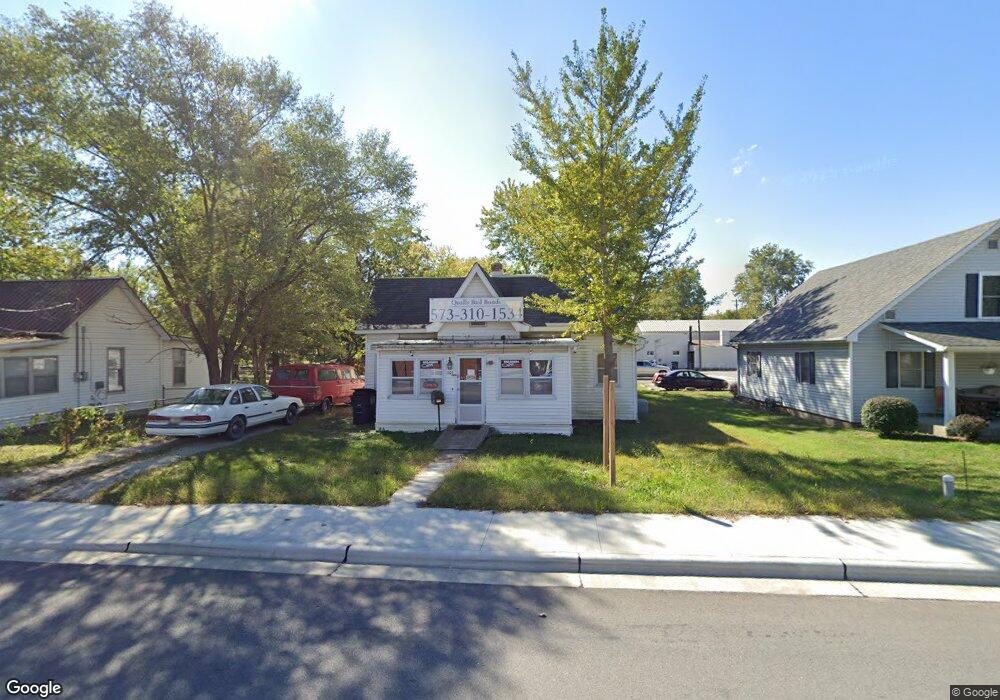
306 E 2nd St Fulton, MO 65251
Estimated Value: $130,390 - $143,000
Studio
--
Bath
974
Sq Ft
$143/Sq Ft
Est. Value
About This Home
This home is located at 306 E 2nd St, Fulton, MO 65251 and is currently estimated at $138,848, approximately $142 per square foot. 306 E 2nd St is a home located in Callaway County with nearby schools including Fulton Senior High School, Kingdom Christian Academy, and St. Peter Catholic School.
Ownership History
Date
Name
Owned For
Owner Type
Purchase Details
Closed on
Jan 26, 2024
Sold by
Digh Ned P and Digh Esther E
Bought by
Qualls Michael Joshua
Current Estimated Value
Purchase Details
Closed on
Nov 10, 2016
Sold by
Goers James Howard and Goers Debra Mae
Bought by
Digh Ned P and Digh Esther E
Create a Home Valuation Report for This Property
The Home Valuation Report is an in-depth analysis detailing your home's value as well as a comparison with similar homes in the area
Home Values in the Area
Average Home Value in this Area
Purchase History
| Date | Buyer | Sale Price | Title Company |
|---|---|---|---|
| Qualls Michael Joshua | -- | None Listed On Document | |
| Digh Ned P | -- | None Available |
Source: Public Records
Tax History
| Year | Tax Paid | Tax Assessment Tax Assessment Total Assessment is a certain percentage of the fair market value that is determined by local assessors to be the total taxable value of land and additions on the property. | Land | Improvement |
|---|---|---|---|---|
| 2025 | $484 | $7,817 | $0 | $0 |
| 2024 | $484 | $7,817 | $0 | $0 |
| 2023 | $484 | $15,351 | $0 | $0 |
| 2022 | $962 | $15,351 | $2,666 | $12,685 |
| 2021 | $961 | $15,351 | $2,666 | $12,685 |
| 2020 | $974 | $15,351 | $2,666 | $12,685 |
| 2019 | $943 | $15,351 | $2,666 | $12,685 |
| 2018 | $536 | $8,596 | $1,583 | $7,013 |
| 2017 | $477 | $8,596 | $1,583 | $7,013 |
| 2016 | $361 | $6,240 | $0 | $0 |
| 2015 | $353 | $6,240 | $0 | $0 |
| 2014 | -- | $6,240 | $0 | $0 |
Source: Public Records
Map
Nearby Homes
Your Personal Tour Guide
Ask me questions while you tour the home.