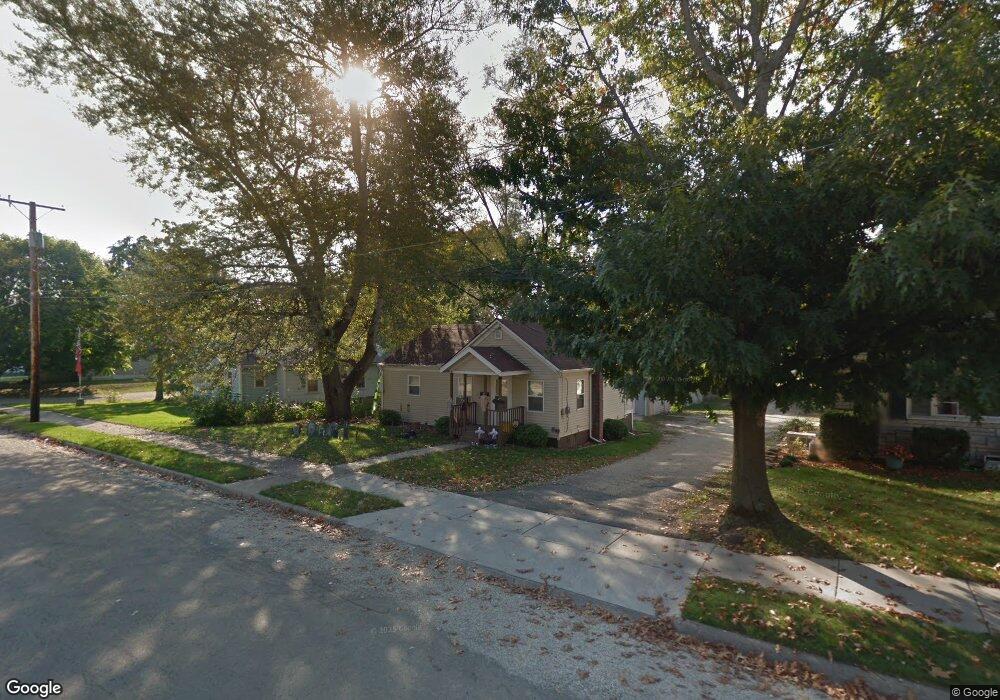
306 E 4th St Rock Falls, IL 61071
Estimated Value: $59,924 - $111,000
Studio
--
Bath
--
Sq Ft
5,227
Sq Ft Lot
About This Home
This home is located at 306 E 4th St, Rock Falls, IL 61071 and is currently estimated at $81,981. 306 E 4th St is a home located in Whiteside County with nearby schools including Merrill Elementary School, Dillon Elementary School, and Rock Falls Middle School.
Ownership History
Date
Name
Owned For
Owner Type
Purchase Details
Closed on
Oct 24, 2022
Sold by
Jellerichs Kathy E
Bought by
Wilson Sheila A
Current Estimated Value
Home Financials for this Owner
Home Financials are based on the most recent Mortgage that was taken out on this home.
Original Mortgage
$56,565
Outstanding Balance
$54,744
Interest Rate
6.92%
Mortgage Type
New Conventional
Estimated Equity
$27,237
Purchase Details
Closed on
Nov 3, 2005
Sold by
Mcintyre David A and Mcintyre Sandra K
Bought by
Jellerichs Gail and Jellerichs Kathy
Create a Home Valuation Report for This Property
The Home Valuation Report is an in-depth analysis detailing your home's value as well as a comparison with similar homes in the area
Home Values in the Area
Average Home Value in this Area
Purchase History
| Date | Buyer | Sale Price | Title Company |
|---|---|---|---|
| Wilson Sheila A | -- | -- | |
| Jellerichs Gail | $16,000 | None Available |
Source: Public Records
Mortgage History
| Date | Status | Borrower | Loan Amount |
|---|---|---|---|
| Open | Wilson Sheila A | $56,565 |
Source: Public Records
Tax History
| Year | Tax Paid | Tax Assessment Tax Assessment Total Assessment is a certain percentage of the fair market value that is determined by local assessors to be the total taxable value of land and additions on the property. | Land | Improvement |
|---|---|---|---|---|
| 2024 | $810 | $19,930 | $2,658 | $17,272 |
| 2023 | $828 | $18,380 | $2,451 | $15,929 |
| 2022 | $2,004 | $17,330 | $2,311 | $15,019 |
| 2021 | $1,927 | $16,395 | $2,186 | $14,209 |
| 2020 | $1,929 | $16,115 | $2,149 | $13,966 |
| 2019 | $1,827 | $15,538 | $2,072 | $13,466 |
| 2018 | $1,597 | $15,192 | $2,026 | $13,166 |
| 2017 | $1,596 | $13,926 | $1,988 | $11,938 |
| 2016 | $1,566 | $13,692 | $1,955 | $11,737 |
| 2015 | $1,415 | $13,162 | $2,054 | $11,108 |
| 2014 | $1,409 | $12,810 | $1,999 | $10,811 |
| 2013 | $1,415 | $13,162 | $2,054 | $11,108 |
Source: Public Records
Map
Nearby Homes
Your Personal Tour Guide
Ask me questions while you tour the home.