Estimated Value: $202,000 - $296,000
--
Bed
1
Bath
1,360
Sq Ft
$188/Sq Ft
Est. Value
About This Home
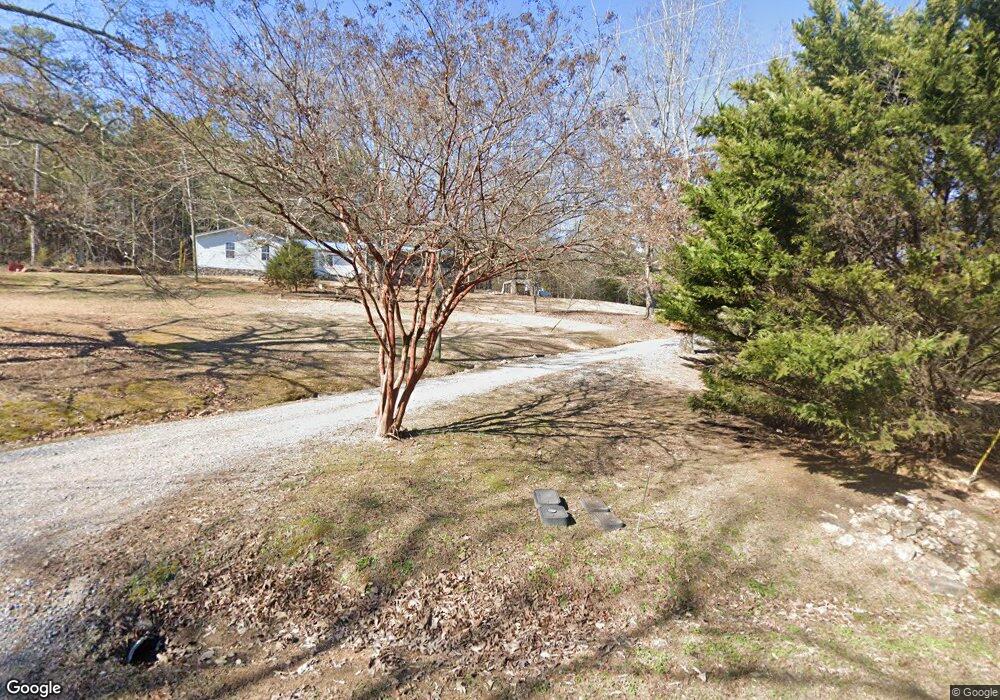
This home is located at 306 Ellis Rd SE, Rome, GA 30161 and is currently estimated at $256,015, approximately $188 per square foot. 306 Ellis Rd SE is a home located in Floyd County with nearby schools including Pepperell Middle School and Pepperell High School.
Ownership History
Date
Name
Owned For
Owner Type
Purchase Details
Closed on
May 25, 2017
Sold by
Edmondson Andrea D
Bought by
Edmondson Andrea D and Ward Stanton Cody
Current Estimated Value
Home Financials for this Owner
Home Financials are based on the most recent Mortgage that was taken out on this home.
Original Mortgage
$64,790
Outstanding Balance
$53,907
Interest Rate
4.03%
Mortgage Type
New Conventional
Estimated Equity
$202,108
Purchase Details
Closed on
Apr 27, 1998
Sold by
Baker Lloyd Gregory
Bought by
Baker Lloyd Gregory and Brads Linda M
Purchase Details
Closed on
Apr 21, 1998
Sold by
Baker Lloyd Gregory and Bradshaw Linda M
Bought by
Baker Lloyd Gregory
Purchase Details
Closed on
Mar 20, 1992
Sold by
Baker Lloyd Gregory
Bought by
Baker Lloyd Gregory and Brads Linda M
Purchase Details
Closed on
Mar 7, 1992
Bought by
Baker Lloyd Gregory
Create a Home Valuation Report for This Property
The Home Valuation Report is an in-depth analysis detailing your home's value as well as a comparison with similar homes in the area
Home Values in the Area
Average Home Value in this Area
Purchase History
| Date | Buyer | Sale Price | Title Company |
|---|---|---|---|
| Edmondson Andrea D | -- | -- | |
| Edmondson Andrea D | $68,200 | -- | |
| Baker Lloyd Gregory | -- | -- | |
| Baker Lloyd Gregory | -- | -- | |
| Baker Lloyd Gregory | -- | -- | |
| Baker Lloyd Gregory | -- | -- |
Source: Public Records
Mortgage History
| Date | Status | Borrower | Loan Amount |
|---|---|---|---|
| Open | Edmondson Andrea D | $64,790 | |
| Closed | Edmondson Andrea D | $64,790 |
Source: Public Records
Tax History Compared to Growth
Tax History
| Year | Tax Paid | Tax Assessment Tax Assessment Total Assessment is a certain percentage of the fair market value that is determined by local assessors to be the total taxable value of land and additions on the property. | Land | Improvement |
|---|---|---|---|---|
| 2024 | $3,085 | $100,976 | $10,560 | $90,416 |
| 2023 | $2,889 | $83,035 | $9,600 | $73,435 |
| 2022 | $2,069 | $69,736 | $7,920 | $61,816 |
| 2021 | $1,789 | $59,255 | $7,209 | $52,046 |
| 2020 | $1,505 | $49,451 | $6,268 | $43,183 |
| 2019 | $1,439 | $47,911 | $6,268 | $41,643 |
| 2018 | $821 | $46,050 | $5,970 | $40,080 |
| 2017 | $494 | $44,815 | $5,528 | $39,287 |
| 2016 | $475 | $43,493 | $5,520 | $37,973 |
| 2015 | $447 | $43,493 | $5,520 | $37,973 |
| 2014 | $447 | $43,493 | $5,520 | $37,973 |
Source: Public Records
Map
Nearby Homes
- 300 Ellis Rd SE
- 142 Ellis Rd SE
- 1850 Pleasant Valley Rd SE
- 1561 Pleasant Valley Rd SE
- Greenbriar Plan at Three Rivers - Maple Street Collection
- Jensen Plan at Three Rivers - Maple Street Collection
- Yosemite Plan at Three Rivers - Maple Street Collection
- Danville Plan at Three Rivers - Maple Street Collection
- Breckenridge Plan at Three Rivers - Maple Street Collection
- Beacon Plan at Three Rivers - Maple Street Collection
- Wesley Plan at Three Rivers - Maple Street Collection
- DaVinci Plan at Three Rivers - Maple Street Collection
- Yosemite Plan at Cherry Glen - Maple Street Collection
- Jensen Plan at Cherry Glen - Maple Street Collection
- Breckenridge Plan at Cherry Glen - Maple Street Collection
- Greenbriar Plan at Cherry Glen - Maple Street Collection
- Wesley Plan at Cherry Glen - Maple Street Collection
- DaVinci Plan at Cherry Glen - Maple Street Collection
- Beacon Plan at Cherry Glen - Maple Street Collection
- 29 Crossridge Dr SE
- 282 Ellis Rd SE
- 299 Ellis Rd SE
- 268 Ellis Rd SE
- 268 Ellis Rd SE
- 1252 Pleasant Valley Rd SE
- 248 Ellis Rd SE
- 248 Ellis Rd SE
- 248 Ellis Rd SE
- 265 Ellis Rd SE
- 1270 Pleasant Valley Rd SE
- 1270 Pleasant Valley Rd SE
- 1293 Pleasant Valley Rd SE
- 210 Ellis Rd SE
- 1298 Pleasant Valley Rd SE
- 1327 Pleasant Valley Rd SE
- 235 Ellis Rd SE
- 304 Ellis Rd SE
- 215 Ellis Rd SE
- 198 Ellis Rd SE
- 198 Ellis Rd SE