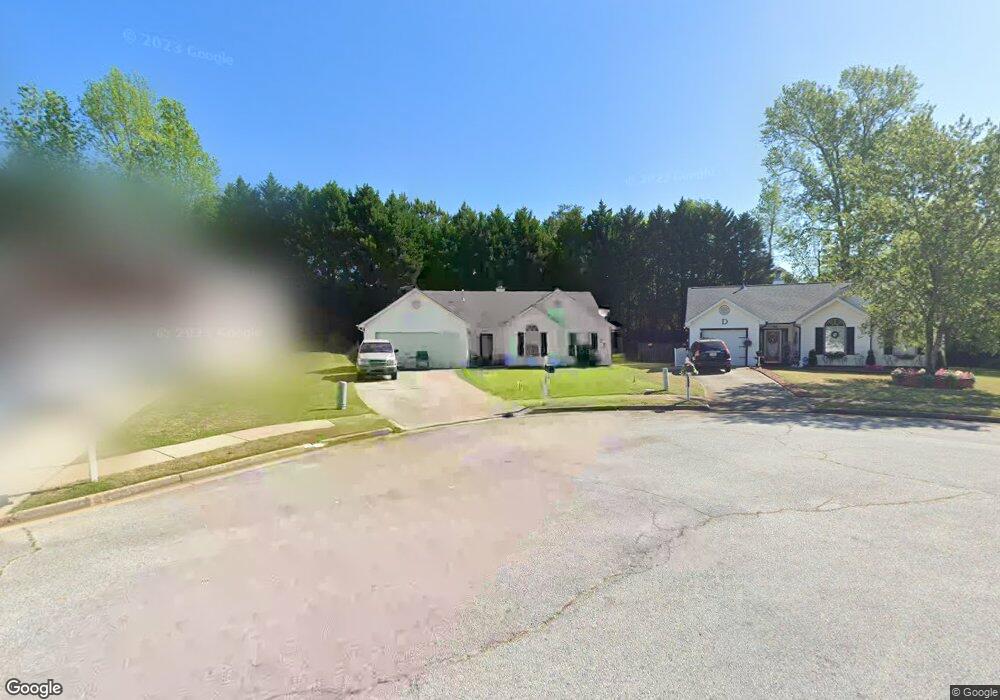
306 Fallview Dr McDonough, GA 30253
Estimated Value: $232,873 - $241,000
3
Beds
2
Baths
1,370
Sq Ft
$173/Sq Ft
Est. Value
About This Home
This home is located at 306 Fallview Dr, McDonough, GA 30253 and is currently estimated at $236,968, approximately $172 per square foot. 306 Fallview Dr is a home located in Henry County with nearby schools including Walnut Creek Elementary School, McDonough Middle School, and McDonough Methodist Academy.
Ownership History
Date
Name
Owned For
Owner Type
Purchase Details
Closed on
Feb 3, 2016
Sold by
Monningh Carlotta A
Bought by
306 Fallview Llc
Current Estimated Value
Purchase Details
Closed on
Sep 14, 2005
Sold by
Monningh Jan S
Bought by
Monningh Carlotta A
Purchase Details
Closed on
May 30, 2002
Sold by
Reese Joyce E
Bought by
Mooningh Jan
Home Financials for this Owner
Home Financials are based on the most recent Mortgage that was taken out on this home.
Original Mortgage
$88,800
Interest Rate
6.85%
Mortgage Type
New Conventional
Purchase Details
Closed on
Jul 30, 2001
Sold by
Reese George
Bought by
Reese Joyce E
Purchase Details
Closed on
Aug 25, 1999
Sold by
Peachtree Homes Inc
Bought by
Reese George A and Reese Joyce E
Home Financials for this Owner
Home Financials are based on the most recent Mortgage that was taken out on this home.
Original Mortgage
$101,636
Interest Rate
7.91%
Mortgage Type
FHA
Create a Home Valuation Report for This Property
The Home Valuation Report is an in-depth analysis detailing your home's value as well as a comparison with similar homes in the area
Home Values in the Area
Average Home Value in this Area
Purchase History
| Date | Buyer | Sale Price | Title Company |
|---|---|---|---|
| 306 Fallview Llc | -- | -- | |
| Monningh Carlotta A | -- | -- | |
| Mooningh Jan | $111,000 | -- | |
| Reese Joyce E | -- | -- | |
| Reese George A | $102,600 | -- |
Source: Public Records
Mortgage History
| Date | Status | Borrower | Loan Amount |
|---|---|---|---|
| Previous Owner | Mooningh Jan | $88,800 | |
| Previous Owner | Reese George A | $101,636 |
Source: Public Records
Tax History
| Year | Tax Paid | Tax Assessment Tax Assessment Total Assessment is a certain percentage of the fair market value that is determined by local assessors to be the total taxable value of land and additions on the property. | Land | Improvement |
|---|---|---|---|---|
| 2025 | $4,069 | $101,920 | $14,000 | $87,920 |
| 2024 | $4,069 | $96,640 | $14,000 | $82,640 |
| 2023 | $3,755 | $96,840 | $12,000 | $84,840 |
| 2022 | $2,938 | $75,560 | $12,000 | $63,560 |
| 2021 | $2,444 | $62,680 | $12,000 | $50,680 |
| 2020 | $2,136 | $54,640 | $8,000 | $46,640 |
| 2019 | $2,076 | $53,080 | $8,000 | $45,080 |
| 2018 | $1,541 | $39,120 | $6,000 | $33,120 |
| 2016 | $1,435 | $36,360 | $6,000 | $30,360 |
| 2015 | $1,283 | $31,440 | $6,000 | $25,440 |
| 2014 | $1,175 | $28,360 | $6,000 | $22,360 |
Source: Public Records
Map
Nearby Homes
- 435 Rosehill Dr
- 20 Rosebud Ln
- 105 Weldon Rd
- 104 Weldon Rd
- 109 Weldon Rd
- 108 Weldon Rd
- 113 Weldon Rd
- 270 Carsons Cove
- 103 Hampton Cir
- 3737 Georgia 20
- 3737 Highway 20
- 408 Autumn Lake Ct Unit 1
- 109 Burleyson Dr
- 115 Samanthas Way
- 3740 Highway 81
- 303 Cameron Rd
- 27 Carmichael St
- 329 Hampton St
- 304 Waterfront Dr
- 237 Jetta Cir
- 304 Fallview Dr
- 308 Fallview Dr
- 310 Fallview Dr
- 302 Fallview Dr
- 302 Fallview Dr Unit UN
- 312 Fallview Dr
- 300 Fallview Dr Unit 3
- 313 Fallview Dr
- 110 Taylor Knoll Way
- 314 Fallview Dr
- 311 Fallview Dr
- 298 Fallview Dr
- 112 Taylor Knoll Way Unit 10
- 112 Taylor Knoll Way
- 309 Fallview Dr
- 316 Fallview Dr
- 307 Fallview Dr
- 201 Coldsprings Ct
- 201 Coldsprings Ct
- 201 Coldsprings Ct Unit 2
Your Personal Tour Guide
Ask me questions while you tour the home.