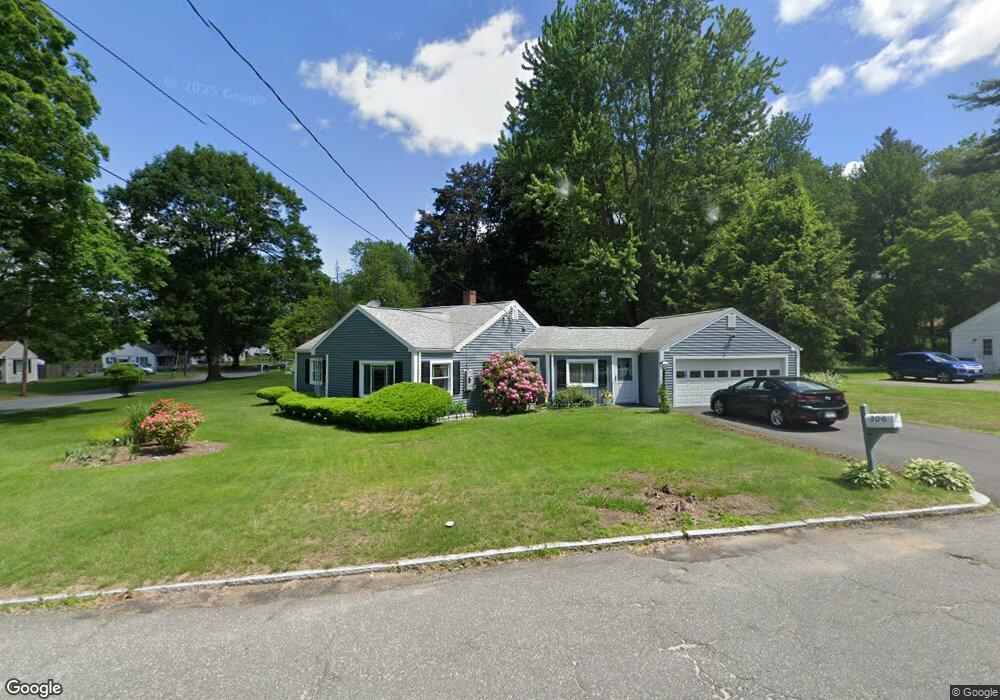
306 Holcomb Rd Springfield, MA 01118
Sixteen Acres NeighborhoodEstimated Value: $308,000 - $344,000
3
Beds
1
Bath
1,252
Sq Ft
$262/Sq Ft
Est. Value
About This Home
This home is located at 306 Holcomb Rd, Springfield, MA 01118 and is currently estimated at $328,361, approximately $262 per square foot. 306 Holcomb Rd is a home located in Hampden County with nearby schools including Arthur T Talmadge Elementary School, M Marcus Kiley Middle, and Springfield High School of Science and Technology.
Ownership History
Date
Name
Owned For
Owner Type
Purchase Details
Closed on
Jun 17, 1993
Sold by
Stanislas Claude F and Stanislas Patricia
Bought by
Robinson Jolene K
Current Estimated Value
Home Financials for this Owner
Home Financials are based on the most recent Mortgage that was taken out on this home.
Original Mortgage
$78,000
Interest Rate
7.38%
Mortgage Type
Purchase Money Mortgage
Create a Home Valuation Report for This Property
The Home Valuation Report is an in-depth analysis detailing your home's value as well as a comparison with similar homes in the area
Home Values in the Area
Average Home Value in this Area
Purchase History
| Date | Buyer | Sale Price | Title Company |
|---|---|---|---|
| Robinson Jolene K | $78,000 | -- |
Source: Public Records
Mortgage History
| Date | Status | Borrower | Loan Amount |
|---|---|---|---|
| Closed | Robinson Jolene K | $78,000 | |
| Previous Owner | Robinson Jolene K | $49,000 |
Source: Public Records
Tax History
| Year | Tax Paid | Tax Assessment Tax Assessment Total Assessment is a certain percentage of the fair market value that is determined by local assessors to be the total taxable value of land and additions on the property. | Land | Improvement |
|---|---|---|---|---|
| 2025 | $4,762 | $303,700 | $58,800 | $244,900 |
| 2024 | $4,140 | $257,800 | $58,800 | $199,000 |
| 2023 | $3,944 | $231,300 | $55,900 | $175,400 |
| 2022 | $3,696 | $196,400 | $55,900 | $140,500 |
| 2021 | $3,585 | $189,700 | $50,900 | $138,800 |
| 2020 | $3,564 | $182,500 | $50,900 | $131,600 |
| 2019 | $3,369 | $171,200 | $50,900 | $120,300 |
| 2018 | $3,342 | $169,800 | $50,900 | $118,900 |
| 2017 | $3,140 | $159,700 | $50,900 | $108,800 |
| 2016 | $3,059 | $155,600 | $50,900 | $104,700 |
| 2015 | $2,919 | $148,400 | $50,900 | $97,500 |
Source: Public Records
Map
Nearby Homes
- 41 Hillside Dr
- 25 Laurelwood Ln
- 24 Wands St
- 85 Talmadge Dr
- 86 Talmadge Dr
- 81 W Crystal Brook Dr
- 86 Wildwood Ave
- 17 Pebble Mill Rd
- 49 Corcoran Blvd
- 1962 Allen St
- 55 Allen St
- 206 Treetop Ave
- 125 Manor Ct Unit 125
- 19 Manor Ct Unit 19
- 101 Regal St
- 17 Skyridge Ln
- 647 Plumtree Rd
- 46 Hadley St
- 0 Apple Blossom Ln
- 55 Old Farm Rd
Your Personal Tour Guide
Ask me questions while you tour the home.