306 Holcomb Rd Springfield, MA 01118
Sixteen Acres NeighborhoodEstimated Value: $304,000 - $331,000
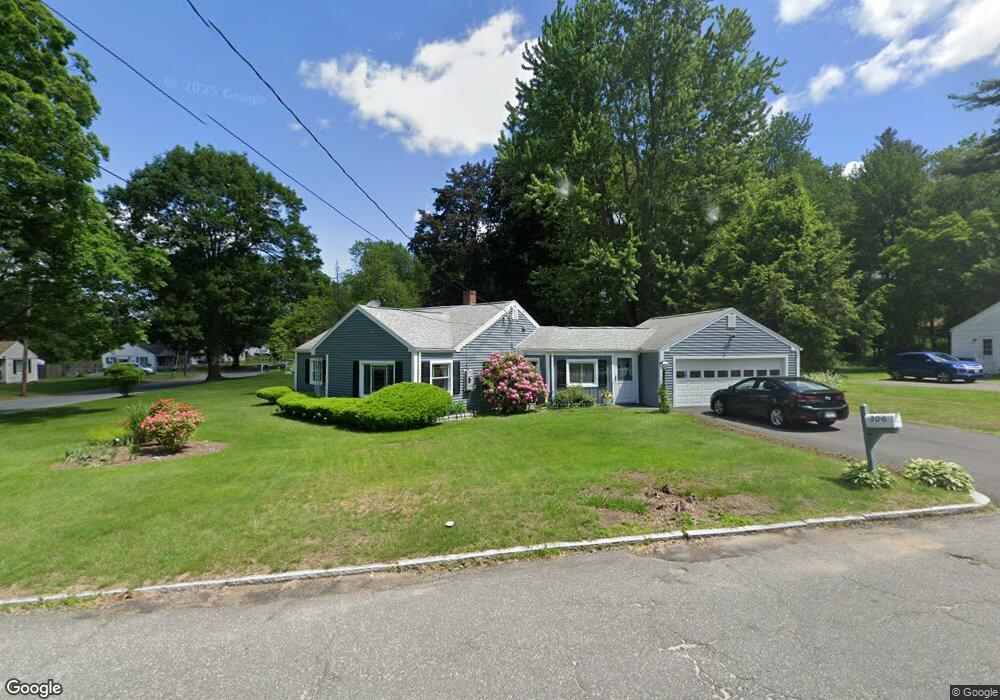
About This Home
This home is located at 306 Holcomb Rd, Springfield, MA 01118 and is currently estimated at $322,460, approximately $257 per square foot. 306 Holcomb Rd is a home located in Hampden County with nearby schools including Arthur T Talmadge Elementary School, M Marcus Kiley Middle, and Springfield High School of Science and Technology.
Ownership History
We collect this data history from publicly available records. To have your information removed, we recommend requesting removal directly through your county’s website.
Purchase Details
Home Financials for this Owner
Home Financials are based on the most recent Mortgage that was taken out on this home.Home Values in the Area
Average Home Value in this Area
Purchase History
We collect this data history from publicly available records. To have your information removed, we recommend requesting removal directly through your county’s website.
| Date | Buyer | Sale Price | Title Company |
|---|---|---|---|
| $78,000 | -- |
Mortgage History
We collect this data history from publicly available records. To have your information removed, we recommend requesting removal directly through your county’s website.
| Date | Status | Borrower | Loan Amount |
|---|---|---|---|
| Closed | $78,000 | ||
| Previous Owner | $49,000 |
Tax History
We collect this data history from publicly available records. To have your information removed, we recommend requesting removal directly through your county’s website.
| Year | Tax Paid | Tax Assessment Tax Assessment Total Assessment is a certain percentage of the fair market value that is determined by local assessors to be the total taxable value of land and additions on the property. | Land | Improvement |
|---|---|---|---|---|
| 2025 | $4,762 | $303,700 | $58,800 | $244,900 |
| 2024 | $4,140 | $257,800 | $58,800 | $199,000 |
| 2023 | $3,944 | $231,300 | $55,900 | $175,400 |
| 2022 | $3,696 | $196,400 | $55,900 | $140,500 |
| 2021 | $3,585 | $189,700 | $50,900 | $138,800 |
| 2020 | $3,564 | $182,500 | $50,900 | $131,600 |
| 2019 | $3,369 | $171,200 | $50,900 | $120,300 |
| 2018 | $3,342 | $169,800 | $50,900 | $118,900 |
| 2017 | $3,140 | $159,700 | $50,900 | $108,800 |
| 2016 | $3,059 | $155,600 | $50,900 | $104,700 |
| 2015 | $2,919 | $148,400 | $50,900 | $97,500 |
Map
- 142 Louis Rd
- 110 W Crystal Brook Dr
- 68 Deepfield Rd
- 87 Squire Ln
- 363 Cooley St
- 21 Ryan Cir
- 346 Newhouse St
- 87 Bridle Path Rd
- 43 Pine Hill Rd
- 97 Treetop Ave
- 55 Allen St
- 43 Sunridge Dr
- 331 Elm St
- 170 Treetop Ave
- 2055 Allen St
- 29 Hudson St
- 103 Manor Ct Unit 103
- 39 Bartels St
- 19 Somerset St
- 148 Hadley St
- 55 Wilshire Rd
- 75 Wilshire Rd
- 66 Wilshire Rd
- 45 Wilshire Rd
- 56 Wilshire Rd
- 56 Wilshire Rd Unit 56
- 76 Wilshire Rd
- 294 Holcomb Rd
- 46 Wilshire Rd
- 35 Wilshire Rd
- 284 Holcomb Rd
- 332 Holcomb Rd
- 36 Wilshire Rd
- 301 Holcomb Rd
- 311 Holcomb Rd
- 3 Hillside Dr
- 321 Holcomb Rd
- 25 Wilshire Rd
- 26 Wilshire Rd
- 14 Kerry Dr
Ask me questions while you tour the home.