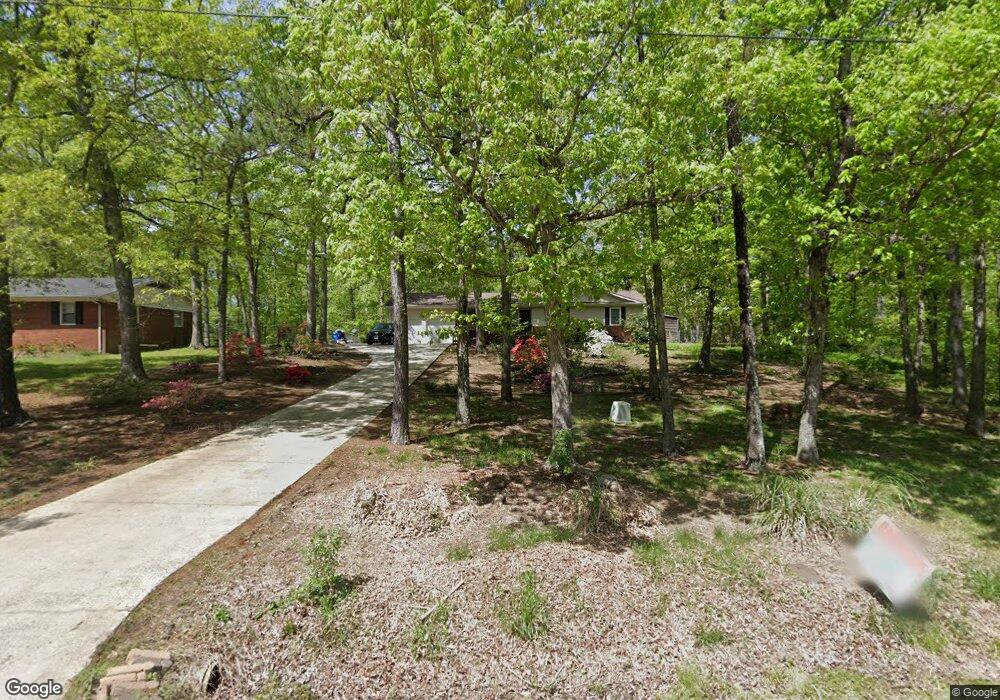
306 Lakeview Rd Unit 2 lots Albemarle, NC 28001
Estimated Value: $377,000 - $430,000
4
Beds
3
Baths
2,989
Sq Ft
$135/Sq Ft
Est. Value
About This Home
This home is located at 306 Lakeview Rd Unit 2 lots, Albemarle, NC 28001 and is currently estimated at $403,770, approximately $135 per square foot. 306 Lakeview Rd Unit 2 lots is a home located in Stanly County with nearby schools including East Albemarle Elementary School, Albemarle Middle School, and Albemarle High School.
Ownership History
Date
Name
Owned For
Owner Type
Purchase Details
Closed on
Mar 13, 2020
Sold by
Wormley Terrence Terrell and Wormley Michelle Diane
Bought by
Stiller Timothy B and Stiller Lori R
Current Estimated Value
Purchase Details
Closed on
Jun 13, 2019
Sold by
Wormley Terrence Terrell and Wormley Michelle Diane
Bought by
Stiller Timothy B and Stiller Lori R
Home Financials for this Owner
Home Financials are based on the most recent Mortgage that was taken out on this home.
Original Mortgage
$235,800
Interest Rate
4.37%
Mortgage Type
Adjustable Rate Mortgage/ARM
Purchase Details
Closed on
Oct 9, 2017
Sold by
Powell Renda and Arrowood Leann Powell
Bought by
Estate Of Bonnie Kay Powell Jr
Purchase Details
Closed on
Jul 10, 2015
Sold by
Carter Deborah Suggs
Bought by
Wormley Terrence Terrell and Wormley Michelle Diane
Create a Home Valuation Report for This Property
The Home Valuation Report is an in-depth analysis detailing your home's value as well as a comparison with similar homes in the area
Home Values in the Area
Average Home Value in this Area
Purchase History
| Date | Buyer | Sale Price | Title Company |
|---|---|---|---|
| Stiller Timothy B | -- | None Available | |
| Stiller Timothy B | $262,000 | None Available | |
| Estate Of Bonnie Kay Powell Jr | -- | None Available | |
| Wormley Terrence Terrell | $210,000 | None Available |
Source: Public Records
Mortgage History
| Date | Status | Borrower | Loan Amount |
|---|---|---|---|
| Previous Owner | Stiller Timothy B | $235,800 |
Source: Public Records
Tax History Compared to Growth
Tax History
| Year | Tax Paid | Tax Assessment Tax Assessment Total Assessment is a certain percentage of the fair market value that is determined by local assessors to be the total taxable value of land and additions on the property. | Land | Improvement |
|---|---|---|---|---|
| 2025 | $3,621 | $323,331 | $35,100 | $288,231 |
| 2024 | $3,126 | $256,265 | $17,901 | $238,364 |
| 2023 | $3,126 | $256,265 | $17,901 | $238,364 |
| 2022 | $3,159 | $258,908 | $17,901 | $241,007 |
| 2021 | $3,159 | $258,908 | $17,901 | $241,007 |
| 2020 | $2,084 | $160,691 | $15,795 | $144,896 |
| 2019 | $2,117 | $160,691 | $15,795 | $144,896 |
| 2018 | $2,105 | $160,691 | $15,795 | $144,896 |
| 2017 | $2,025 | $160,691 | $15,795 | $144,896 |
| 2016 | $1,867 | $148,162 | $14,040 | $134,122 |
| 2015 | $1,775 | $139,438 | $14,040 | $125,398 |
| 2014 | $1,797 | $139,438 | $14,040 | $125,398 |
Source: Public Records
Map
Nearby Homes
- 2106 Woodhurst Ln
- 120 Pembroke Way Unit 15p
- 2012 E Main St
- 2146 Marwood Ln
- 2148 Marwood Ln
- 712 Coventry Dr
- 2305 Bulwarks Ct
- 2305 Bulwarks Ct Unit 6
- 107 Pembroke Way Unit 95p
- 2313 Bulwarks Ct
- 2313 Bulwarks Ct Unit 2
- Calloway Plan at Morrow Brook
- Winslow Plan at Morrow Brook
- TA3000 Plan at Morrow Brook
- Hudson Plan at Morrow Brook
- Declan Plan at Morrow Brook
- Devin Plan at Morrow Brook
- Huntley Plan at Morrow Brook
- Kipling Plan at Morrow Brook
- Lenox Plan at Morrow Brook
- 306 Lakeview Rd
- 306 Lakeview Rd Unit 13-15
- 308 Lakeview Rd
- 737 Yorkshire Dr
- 715 Yorkshire Dr
- 735 Yorkshire Dr
- 725 Yorkshire Dr
- 835 Yorkshire Dr
- 723 Yorkshire Dr
- 739 Yorkshire Dr
- 738 Yorkshire Dr
- 833 Yorkshire Dr
- 736 Yorkshire Dr
- 727 Yorkshire Dr
- 719 Yorkshire Dr Unit 28A
- 718 Yorkshire Dr
- 740 Yorkshire Dr
- 716 Yorkshire Dr Unit 32A
- 717 Yorkshire Dr Unit 29A
- 720 Yorkshire Dr Unit 34-A