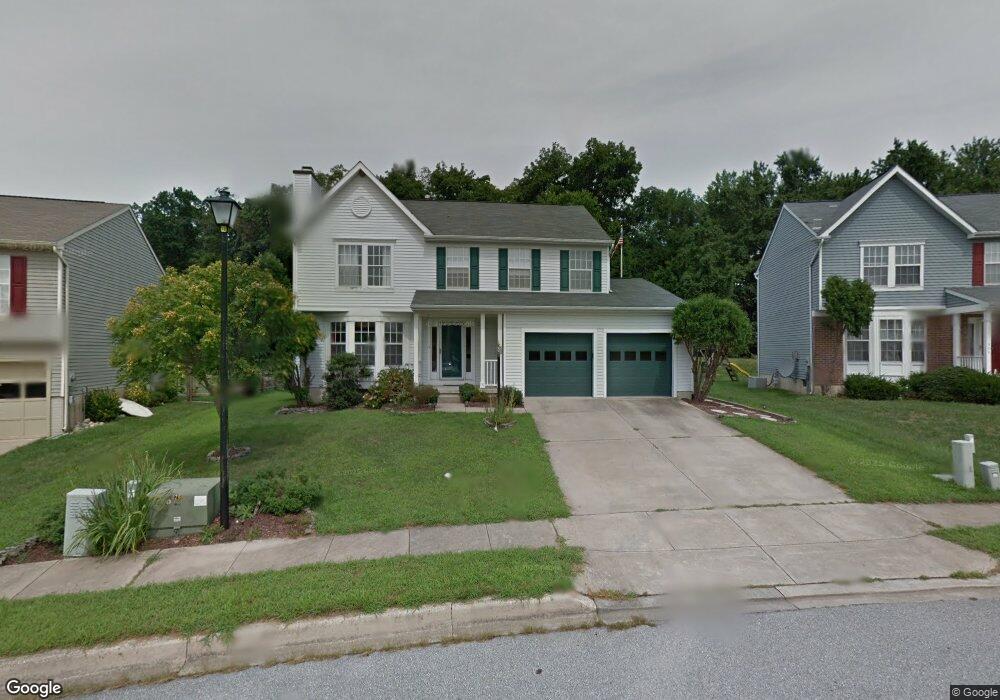
306 Macduff Rd Newark, DE 19711
Estimated Value: $353,000 - $439,000
4
Beds
3
Baths
1,875
Sq Ft
$219/Sq Ft
Est. Value
About This Home
This home is located at 306 Macduff Rd, Newark, DE 19711 and is currently estimated at $411,322, approximately $219 per square foot. 306 Macduff Rd is a home located in New Castle County with nearby schools including Downes (John R.) Elementary School, Shue-Medill Middle School, and Newark High School.
Ownership History
Date
Name
Owned For
Owner Type
Purchase Details
Closed on
Feb 2, 2023
Sold by
Haley Joseph P
Bought by
Haley Joseph P and Haley Pamela
Current Estimated Value
Purchase Details
Closed on
Jan 10, 2000
Bought by
Haley Joseph P Abbotsford
Create a Home Valuation Report for This Property
The Home Valuation Report is an in-depth analysis detailing your home's value as well as a comparison with similar homes in the area
Home Values in the Area
Average Home Value in this Area
Purchase History
| Date | Buyer | Sale Price | Title Company |
|---|---|---|---|
| Haley Joseph P | -- | -- | |
| Haley Joseph P Abbotsford | -- | -- |
Source: Public Records
Tax History
| Year | Tax Paid | Tax Assessment Tax Assessment Total Assessment is a certain percentage of the fair market value that is determined by local assessors to be the total taxable value of land and additions on the property. | Land | Improvement |
|---|---|---|---|---|
| 2024 | $895 | $84,800 | $13,700 | $71,100 |
| 2023 | $3,066 | $84,800 | $13,700 | $71,100 |
| 2022 | $3,034 | $84,800 | $13,700 | $71,100 |
| 2021 | $2,956 | $84,800 | $13,700 | $71,100 |
| 2020 | $2,871 | $84,800 | $13,700 | $71,100 |
| 2019 | $2,517 | $84,800 | $13,700 | $71,100 |
| 2018 | $2,458 | $84,800 | $13,700 | $71,100 |
| 2017 | $2,385 | $84,800 | $13,700 | $71,100 |
| 2016 | $2,379 | $84,800 | $13,700 | $71,100 |
| 2015 | $2,132 | $84,800 | $13,700 | $71,100 |
| 2014 | $2,132 | $84,800 | $13,700 | $71,100 |
Source: Public Records
Map
Nearby Homes
Your Personal Tour Guide
Ask me questions while you tour the home.