
Seller's Agent in 2024
John McCarthy
Rowley Realty
(978) 835-2573
61 in this area
91 Total Sales
Estimated Value: $522,810 - $551,000
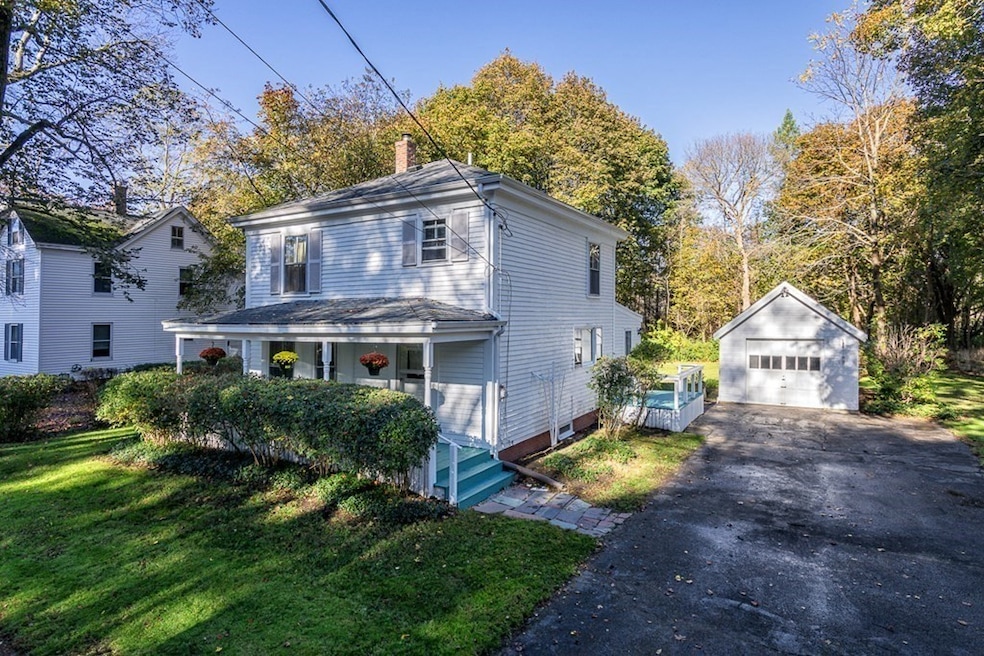
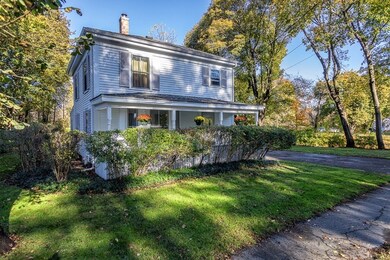
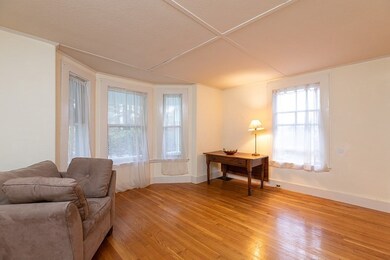
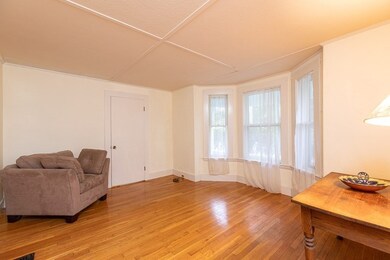
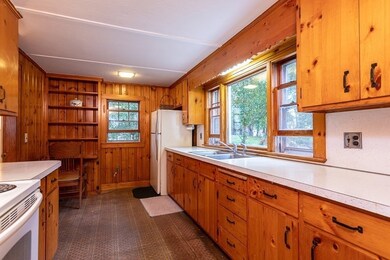
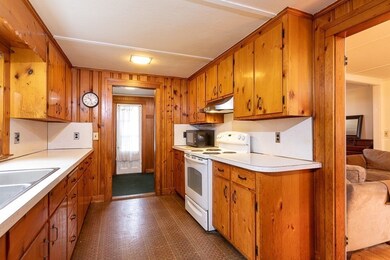
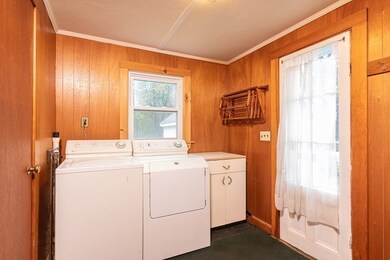
Welcome to this charming colonial, a hidden gem in a great location near the elementary school and downtown. Enter off the welcoming farmers porch which invites you to spend lazy afternoons with a rocking chair. Lots of hardwood flooring inside and a beautiful large flat backyard and detached garage outside. With three bedrooms and one bath, eat in kitchen with built in shelving, laundry room, living room AND family room. The buyer will have an opportunity to update this house and bring it to its original beauty. A 15 minute walk to the Rowley MBTA commuter rail line giving you easy access to Boston. First showings at Open Houses on Saturday, Nov. 18th from 12-1:30 and Sunday, Nov. 19th from 2-3:30. Offers due by Tuesday, Nov. 21st at Noon.
| Date | Buyer | Sale Price | Title Company |
|---|---|---|---|
| Ichizawa Masanori | $330,000 | -- |
| Date | Status | Borrower | Loan Amount |
|---|---|---|---|
| Open | Ichizawa Masanori | $237,500 | |
| Closed | Ichizawa Masanori | $249,000 |
| Date | Event | Price | List to Sale | Price per Sq Ft |
|---|---|---|---|---|
| 02/14/2024 02/14/24 | Sold | $465,000 | +3.3% | $337 / Sq Ft |
| 11/21/2023 11/21/23 | Pending | -- | -- | -- |
| 11/14/2023 11/14/23 | For Sale | $450,000 | -- | $326 / Sq Ft |
| Year | Tax Paid | Tax Assessment Tax Assessment Total Assessment is a certain percentage of the fair market value that is determined by local assessors to be the total taxable value of land and additions on the property. | Land | Improvement |
|---|---|---|---|---|
| 2025 | $5,681 | $482,700 | $243,100 | $239,600 |
| 2024 | $5,573 | $460,600 | $231,500 | $229,100 |
| 2023 | $5,416 | $416,000 | $201,300 | $214,700 |
| 2022 | $5,072 | $346,900 | $167,700 | $179,200 |
| 2021 | $4,900 | $314,500 | $145,800 | $168,700 |
| 2020 | $4,915 | $315,500 | $138,900 | $176,600 |
| 2019 | $4,361 | $297,100 | $138,900 | $158,200 |
| 2018 | $4,160 | $285,300 | $138,900 | $146,400 |
| 2017 | $4,077 | $288,300 | $141,900 | $146,400 |
| 2016 | $3,929 | $273,600 | $123,300 | $150,300 |
| 2015 | $3,413 | $239,700 | $123,300 | $116,400 |
Seller's Agent in 2024
John McCarthy
Rowley Realty
(978) 835-2573
61 in this area
91 Total Sales
P
Seller Co-Listing Agent in 2024
Pauline White
Rowley Realty
(978) 314-7341
32 in this area
39 Total Sales
Source: MLS Property Information Network (MLS PIN)
MLS Number: 73180324
APN: ROWL-000027-000004
Disclaimer: Certain information contained herein is derived from information provided by parties other than Homes.com. All information provided is deemed reliable, but is not guaranteed to be accurate and should be independently verified.
![]() The property listing data and information, or the Images, set forth herein were provided to MLS Property Information Network, Inc. from third party sources, including sellers, lessors and public records, and were compiled by MLS Property Information Network, Inc. The property listing data and information, and the Images, are for the personal, non-commercial use of consumers having a good faith interest in purchasing or leasing listed properties of the type displayed to them and may not be used for any purpose other than to identify prospective properties which such consumers may have a good faith interest in purchasing or leasing. MLS Property Information Network, Inc. and its subscribers disclaim any and all representations and warranties as to the accuracy of the property listing data and information, or as to the accuracy of any of the Images, set forth herein.
The property listing data and information, or the Images, set forth herein were provided to MLS Property Information Network, Inc. from third party sources, including sellers, lessors and public records, and were compiled by MLS Property Information Network, Inc. The property listing data and information, and the Images, are for the personal, non-commercial use of consumers having a good faith interest in purchasing or leasing listed properties of the type displayed to them and may not be used for any purpose other than to identify prospective properties which such consumers may have a good faith interest in purchasing or leasing. MLS Property Information Network, Inc. and its subscribers disclaim any and all representations and warranties as to the accuracy of the property listing data and information, or as to the accuracy of any of the Images, set forth herein.
Ask me questions while you tour the home.