306 Maple St Cedar Point, IL 61316
Estimated Value: $156,000 - $170,000
3
Beds
2
Baths
1,551
Sq Ft
$105/Sq Ft
Est. Value
About This Home
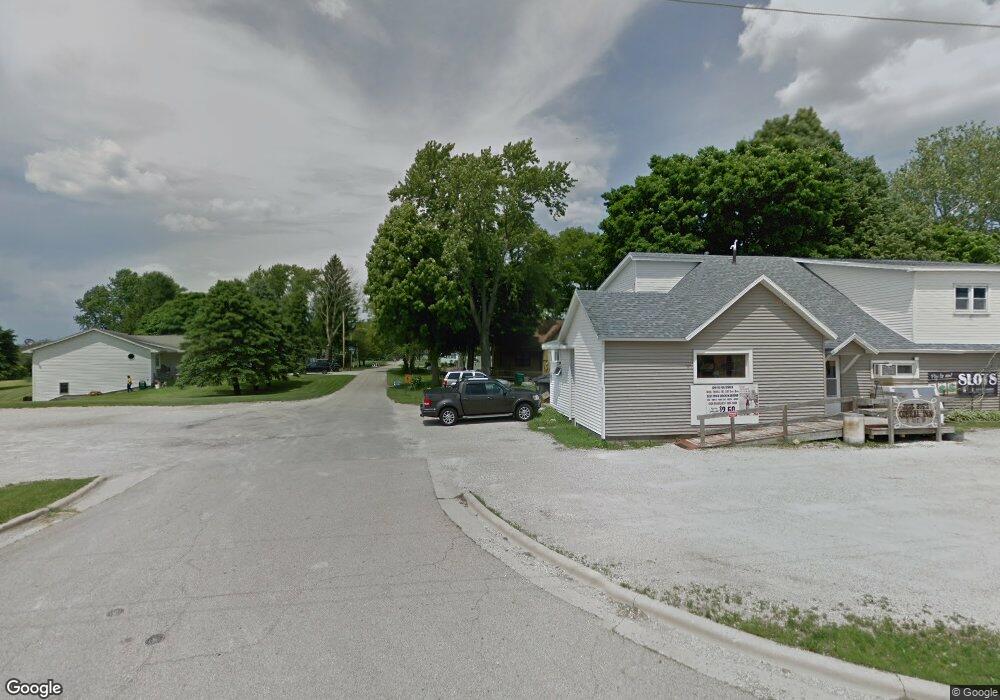
This home is located at 306 Maple St, Cedar Point, IL 61316 and is currently estimated at $162,843, approximately $104 per square foot. 306 Maple St is a home located in LaSalle County with nearby schools including Lincoln Elementary School and Washington Elementary School.
Ownership History
Date
Name
Owned For
Owner Type
Purchase Details
Closed on
Jun 30, 2021
Sold by
Dzierzynski Duane A and Dzierzynski Michelle
Bought by
Kiley Jordan
Current Estimated Value
Home Financials for this Owner
Home Financials are based on the most recent Mortgage that was taken out on this home.
Original Mortgage
$96,000
Outstanding Balance
$87,105
Interest Rate
2.9%
Mortgage Type
New Conventional
Estimated Equity
$75,738
Purchase Details
Closed on
Dec 10, 2018
Sold by
Saloga Barbara A and Saloga Barbara A
Bought by
Dzierzynski Duane A
Home Financials for this Owner
Home Financials are based on the most recent Mortgage that was taken out on this home.
Original Mortgage
$77,404
Interest Rate
4.8%
Mortgage Type
New Conventional
Purchase Details
Closed on
May 31, 2013
Sold by
Weiden Marie R and Weiden Marie R
Bought by
Saloga Barbara A and Barbara A Saloga Declaration Of Trust
Create a Home Valuation Report for This Property
The Home Valuation Report is an in-depth analysis detailing your home's value as well as a comparison with similar homes in the area
Purchase History
| Date | Buyer | Sale Price | Title Company |
|---|---|---|---|
| Kiley Jordan | $120,000 | None Available | |
| Dzierzynski Duane A | $77,500 | None Available | |
| Saloga Barbara A | $75,000 | None Available |
Source: Public Records
Mortgage History
| Date | Status | Borrower | Loan Amount |
|---|---|---|---|
| Open | Kiley Jordan | $96,000 | |
| Previous Owner | Dzierzynski Duane A | $77,404 |
Source: Public Records
Tax History
| Year | Tax Paid | Tax Assessment Tax Assessment Total Assessment is a certain percentage of the fair market value that is determined by local assessors to be the total taxable value of land and additions on the property. | Land | Improvement |
|---|---|---|---|---|
| 2024 | $3,451 | $47,522 | $3,097 | $44,425 |
| 2023 | $3,050 | $41,649 | $2,714 | $38,935 |
| 2022 | $2,717 | $37,884 | $2,469 | $35,415 |
| 2021 | $2,528 | $34,490 | $2,248 | $32,242 |
| 2020 | $2,450 | $34,490 | $2,248 | $32,242 |
| 2019 | $2,568 | $34,490 | $2,248 | $32,242 |
| 2018 | $3,043 | $34,169 | $2,227 | $31,942 |
| 2017 | $2,830 | $31,411 | $2,047 | $29,364 |
| 2016 | $2,839 | $31,091 | $2,026 | $29,065 |
| 2015 | $2,597 | $30,183 | $1,967 | $28,216 |
| 2012 | -- | $40,117 | $2,109 | $38,008 |
Source: Public Records
Map
Nearby Homes
- 303 E 1st St
- 82 N 23rd Rd
- 164 Claret Knoll Ave
- 190 N 20th Rd
- 580 W Walnut St
- 815 W Walnut St
- 100 N Lewis Ave
- 641 W St
- 223 A Oakwood Ave
- 372 N 2629th Rd
- 298 Sunset Blvd
- 71 Katelyn Ct
- 2585 E 450th Rd
- 0 Deerfield Estates Lot 78 Rd
- 204 N Woodland Ave
- 2128 State St
- 1704 Main St
- 230 E Porter St
- Lot 1 Watson Ave
- 2001 3rd St
Your Personal Tour Guide
Ask me questions while you tour the home.