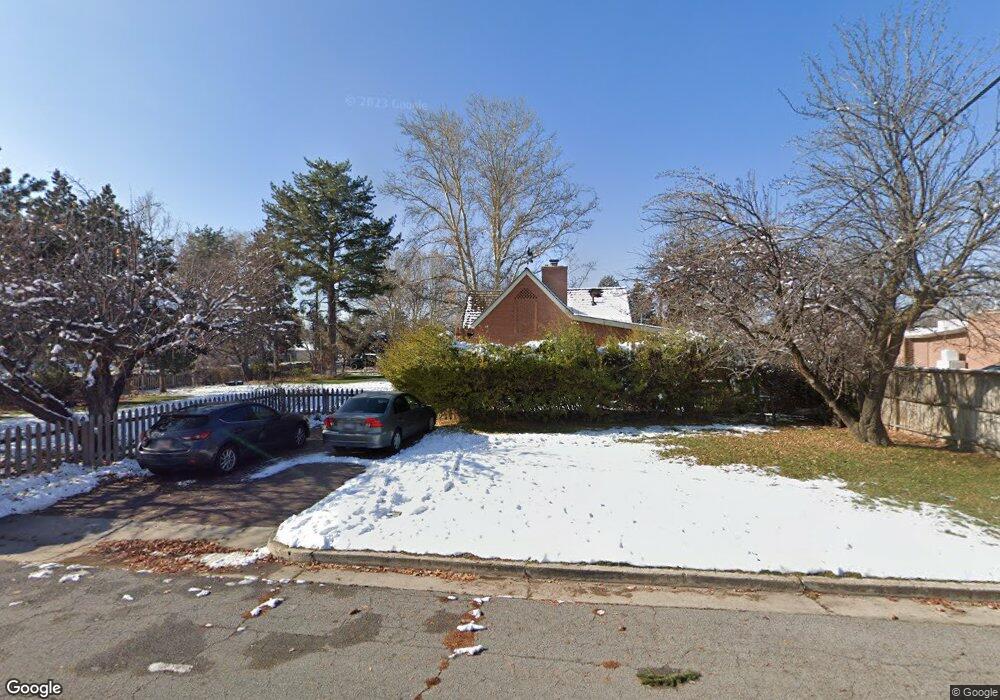
306 N 825 E American Fork, UT 84003
Estimated Value: $496,000 - $530,000
3
Beds
2
Baths
2,067
Sq Ft
$245/Sq Ft
Est. Value
About This Home
This home is located at 306 N 825 E, American Fork, UT 84003 and is currently estimated at $507,339, approximately $245 per square foot. 306 N 825 E is a home located in Utah County with nearby schools including Barratt Elementary School, American Fork Junior High School, and American Fork High School.
Ownership History
Date
Name
Owned For
Owner Type
Purchase Details
Closed on
May 31, 2017
Sold by
Caceres Carlos
Bought by
Tungate James and Griffin Katherine
Current Estimated Value
Home Financials for this Owner
Home Financials are based on the most recent Mortgage that was taken out on this home.
Original Mortgage
$252,200
Outstanding Balance
$209,490
Interest Rate
3.97%
Mortgage Type
New Conventional
Estimated Equity
$297,849
Purchase Details
Closed on
Jun 27, 2005
Sold by
Brown Justin P and Brown Erin P
Bought by
Caceres Carlos
Home Financials for this Owner
Home Financials are based on the most recent Mortgage that was taken out on this home.
Original Mortgage
$160,236
Interest Rate
5.58%
Mortgage Type
FHA
Purchase Details
Closed on
Aug 11, 1999
Sold by
Brady Kenneth G and Brady Jane D
Bought by
Brown Justin P and Brown Erin P
Home Financials for this Owner
Home Financials are based on the most recent Mortgage that was taken out on this home.
Original Mortgage
$131,100
Interest Rate
7.7%
Create a Home Valuation Report for This Property
The Home Valuation Report is an in-depth analysis detailing your home's value as well as a comparison with similar homes in the area
Home Values in the Area
Average Home Value in this Area
Purchase History
| Date | Buyer | Sale Price | Title Company |
|---|---|---|---|
| Tungate James | -- | Highland Title | |
| Caceres Carlos | -- | Horizon Title Insurance | |
| Brown Justin P | -- | Empire Land Title Company |
Source: Public Records
Mortgage History
| Date | Status | Borrower | Loan Amount |
|---|---|---|---|
| Open | Tungate James | $252,200 | |
| Previous Owner | Caceres Carlos | $160,236 | |
| Previous Owner | Brown Justin P | $131,100 |
Source: Public Records
Tax History Compared to Growth
Tax History
| Year | Tax Paid | Tax Assessment Tax Assessment Total Assessment is a certain percentage of the fair market value that is determined by local assessors to be the total taxable value of land and additions on the property. | Land | Improvement |
|---|---|---|---|---|
| 2025 | $1,941 | $217,250 | $226,900 | $168,100 |
| 2024 | $1,941 | $215,710 | $0 | $0 |
| 2023 | $1,825 | $214,940 | $0 | $0 |
| 2022 | $1,992 | $231,550 | $0 | $0 |
| 2021 | $1,696 | $308,000 | $162,800 | $145,200 |
| 2020 | $1,582 | $278,600 | $145,400 | $133,200 |
| 2019 | $1,448 | $263,800 | $141,300 | $122,500 |
| 2018 | $1,356 | $236,200 | $128,800 | $107,400 |
| 2017 | $1,239 | $116,490 | $0 | $0 |
| 2016 | $1,100 | $96,085 | $0 | $0 |
| 2015 | $1,159 | $96,085 | $0 | $0 |
| 2014 | $1,175 | $96,085 | $0 | $0 |
Source: Public Records
Map
Nearby Homes